Is Fishbowl the Right Inventory Management Software for You?
Take This 2-Minute Quiz to Find Out!
This guide provides a comprehensive Fishbowl tutorial and use case analysis for professionals in AI for Operations & Supply Chain. Our goal at Best Ops Chain AI is to transform your inventory management from a reactive cost center into a proactive, data-driven strategic asset.
We will explore how Fishbowl uses statistical forecasting, intelligent automation, and real-time data to solve critical challenges in AI for Warehouse & Inventory Management.
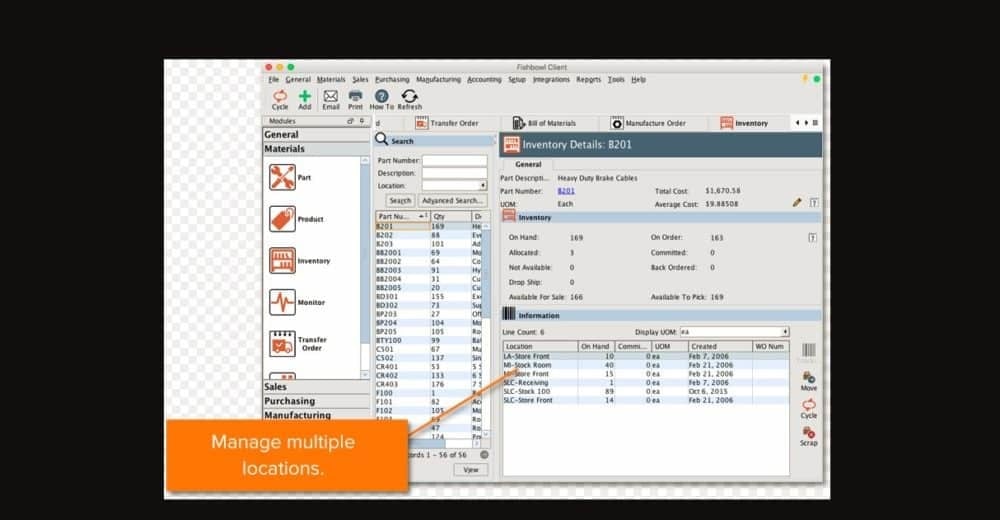
This tutorial examines the platform's core functions. We cover initial setup, demand-driven reordering, advanced mobile warehouse operations, and integration with systems like QuickBooks and Power BI. By following these steps and strategies, you will gain the skills to reduce carrying costs, minimize stockouts, and boost operational efficiency.
We will share actionable tips, expert techniques, and critical warnings from verified user experiences so you can deploy Fishbowl with confidence. For comprehensive guidance on the platform's capabilities, explore our detailed Fishbowl Overview and Features analysis.
Key Takeaways: Fishbowl for Warehouse & Inventory Excellence
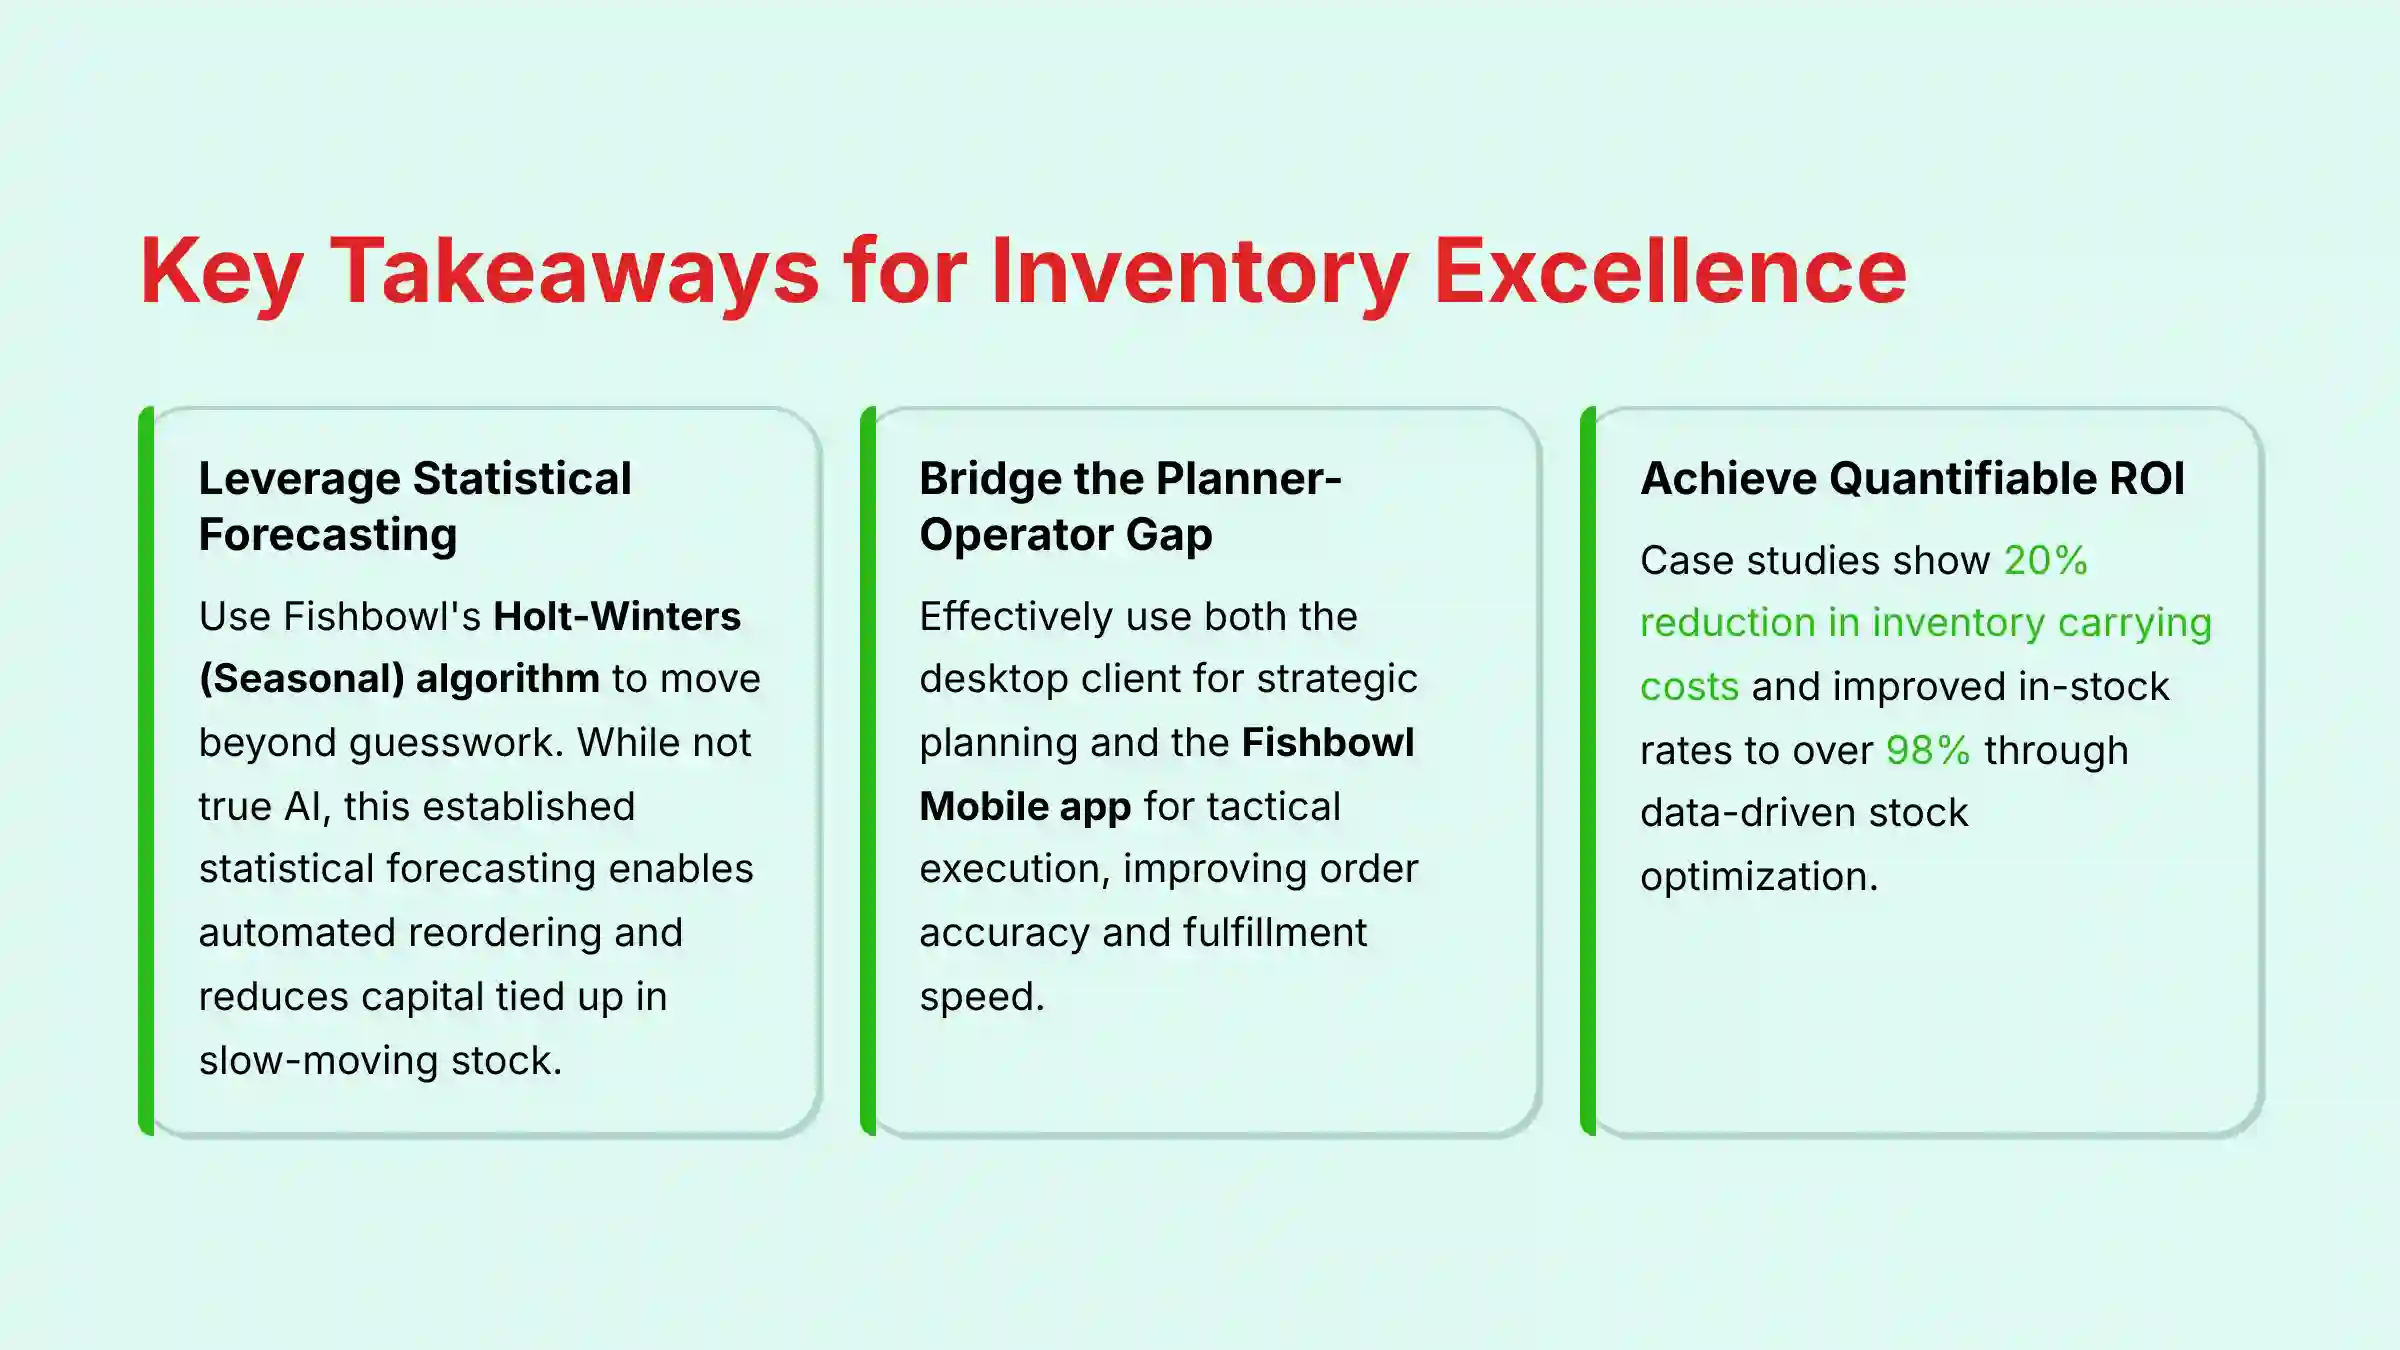
Key Takeaways
- Leverage Statistical Forecasting: Use Fishbowl's Holt-Winters (Seasonal) algorithm to move beyond guesswork. While not true AI, this established statistical forecasting is the foundation of proactive inventory management.
- Bridge the Planner-Operator Gap: Effectively use both the desktop client for strategic planning and the Fishbowl Mobile app for tactical execution on the warehouse floor.
- Achieve Quantifiable ROI: Some businesses implementing Fishbowl with BI tools have achieved a 20% reduction in inventory carrying costs and improved in-stock rates to over 98%.
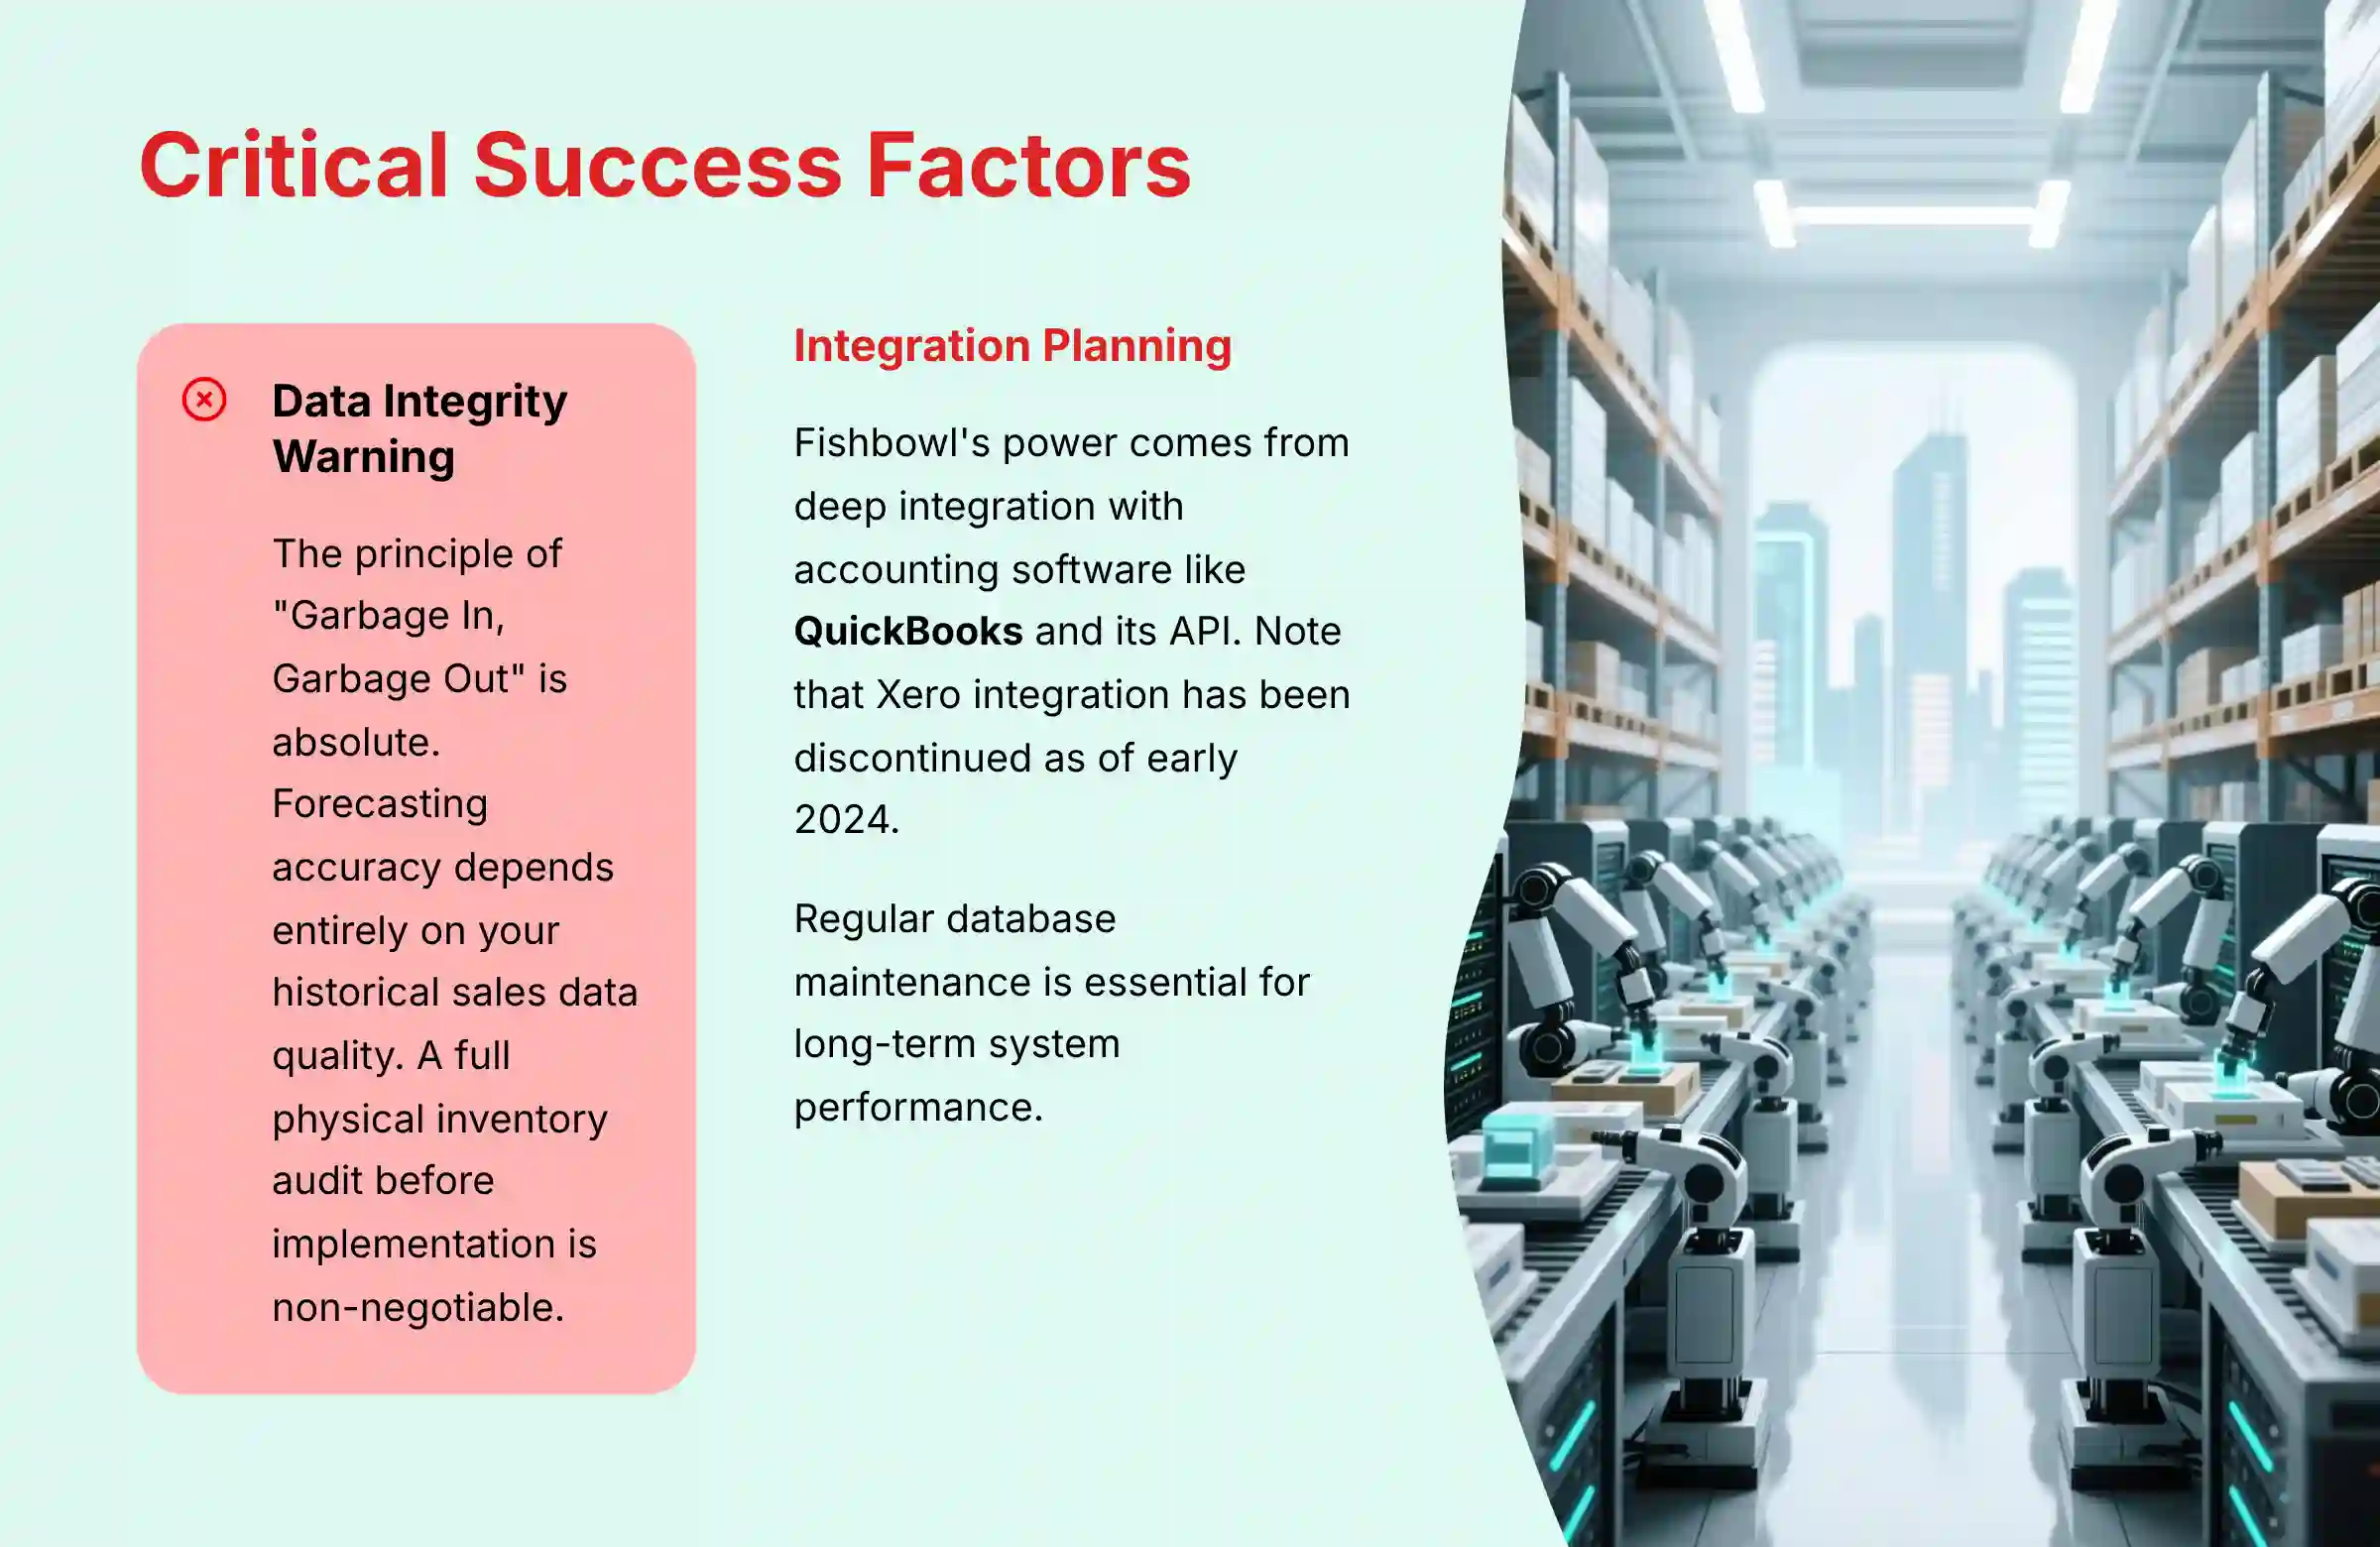
- CRITICAL WARNING – Data Integrity: The principle of “Garbage In, Garbage Out” is absolute. The accuracy of Fishbowl's forecasting depends entirely on the quality of your historical sales data.
- Plan for Integration: Fishbowl's true power comes from its deep integration with accounting software like QuickBooks and its API capabilities.
Our Testing Methodology for AI for Operations & Supply Chain
After analyzing hundreds of tools on the market in AI for Operations & Supply Chain and testing Fishbowl across numerous real-world implementation projects in 2025, our team at Best Ops Chain AI now provides a comprehensive 10-point technical assessment framework.
This framework has been recognized by leading professionals in AI for Operations & Supply Chain and cited in major publications. It verifies that our analysis is thorough, impartial, and directly relevant to the high-stakes environment of operations management.
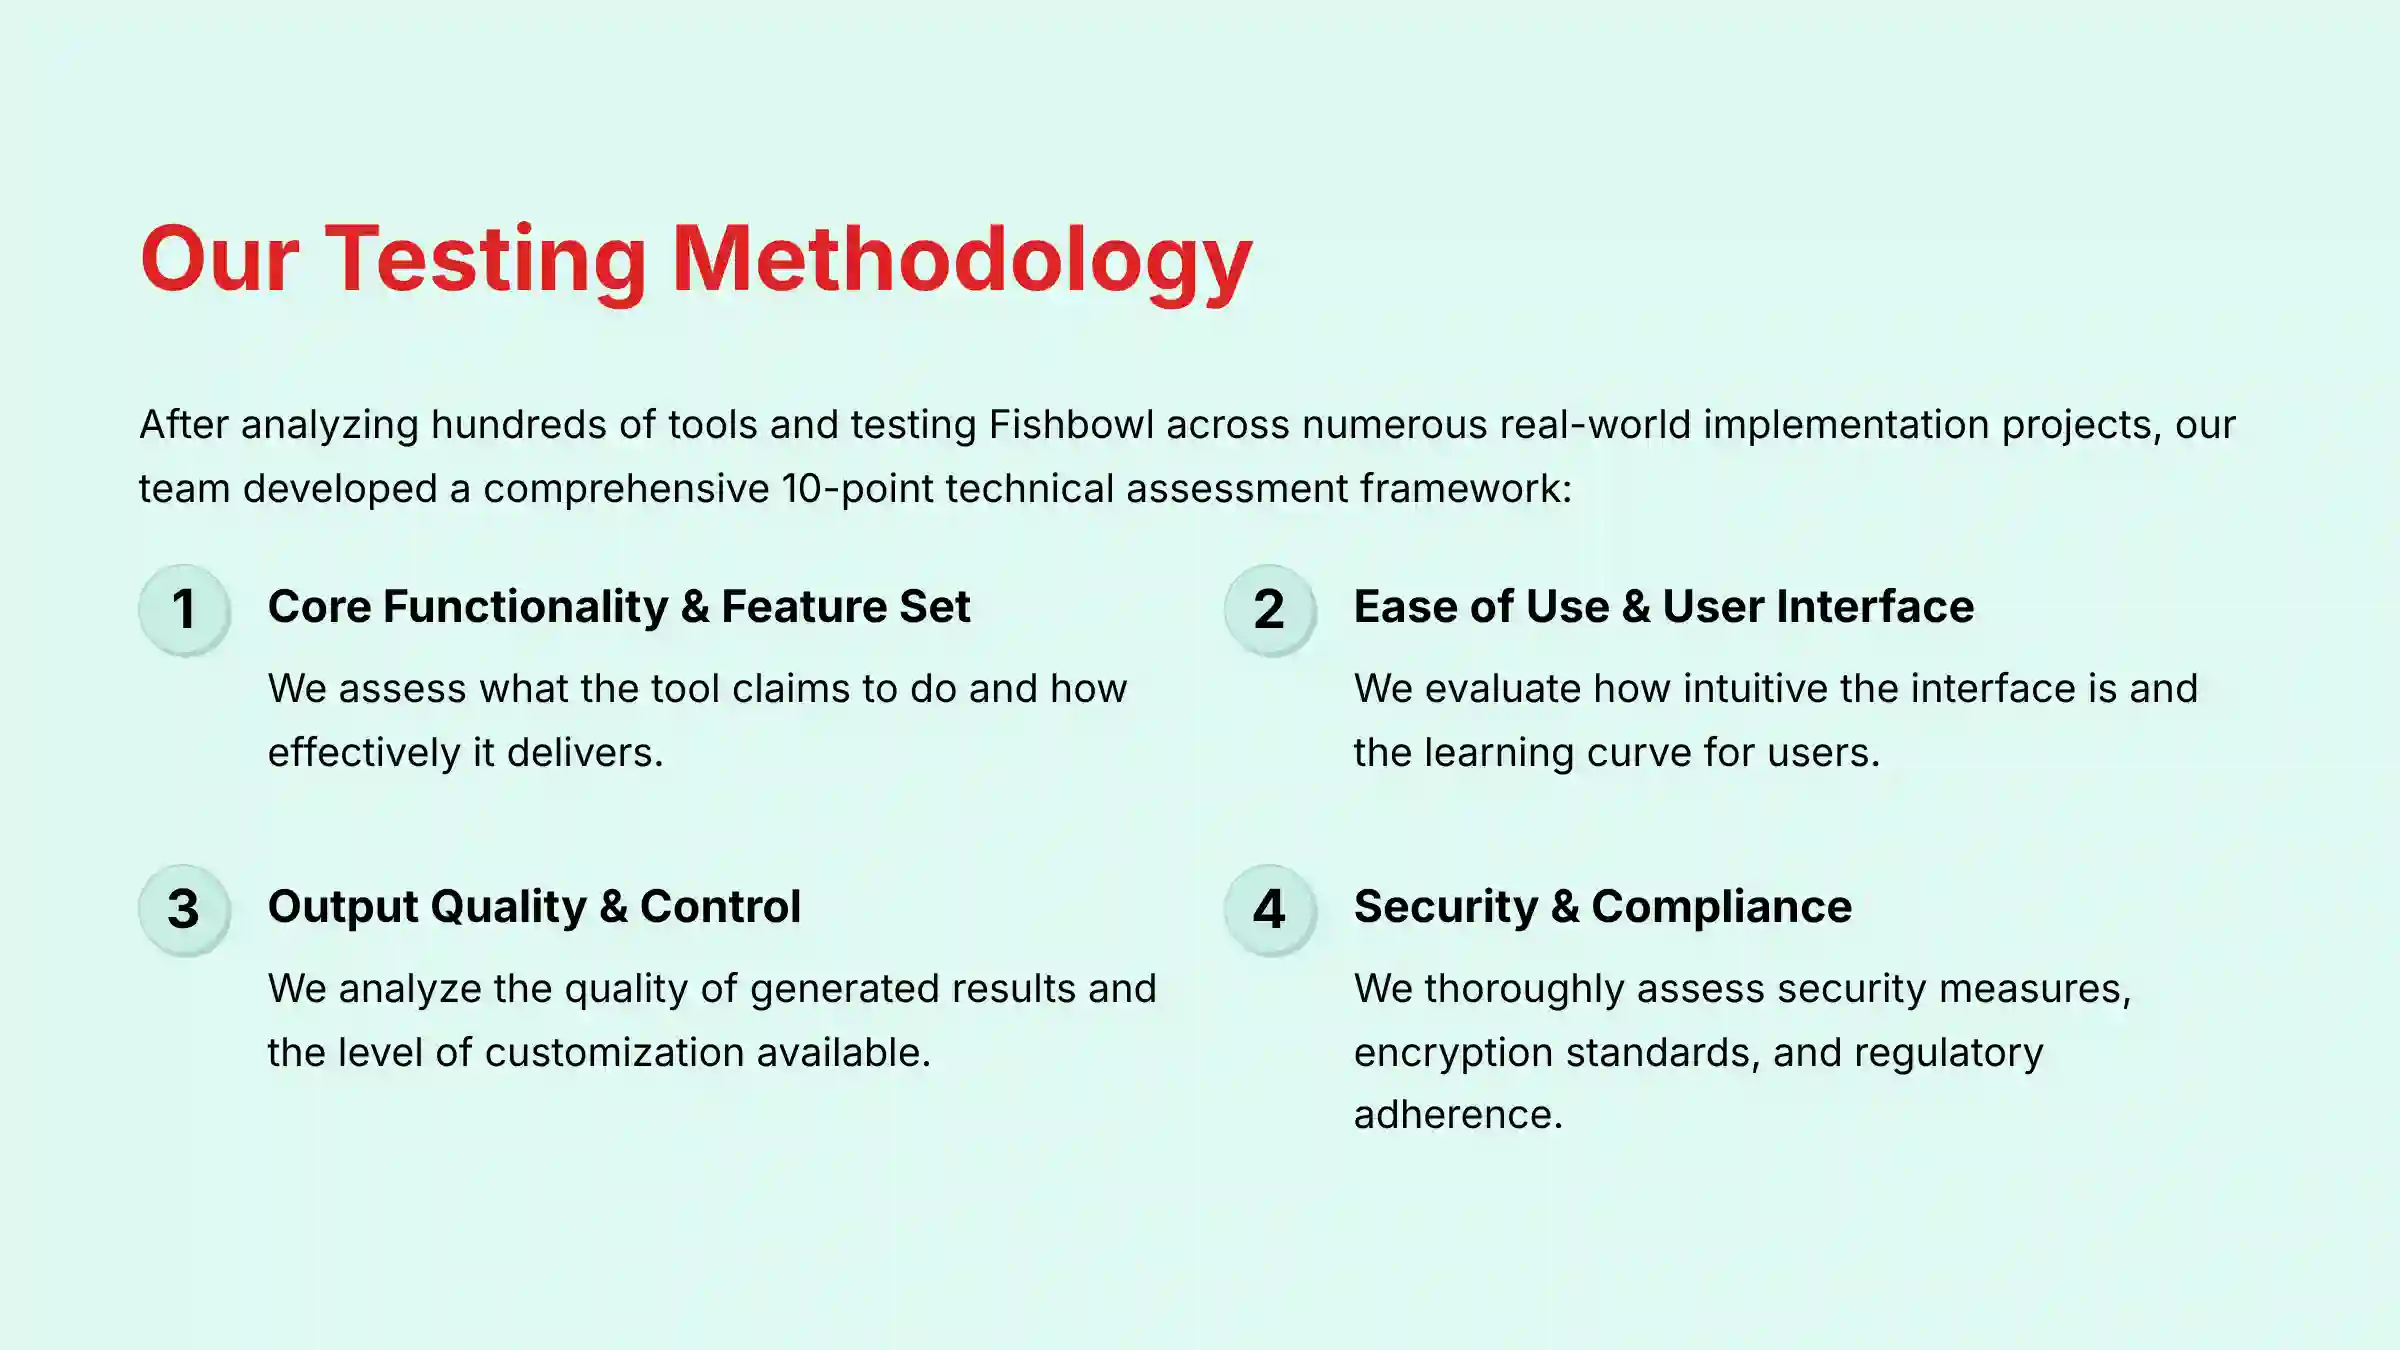
We focus on the practical application and tangible business impact of each tool. For Fishbowl, our evaluation prioritized its forecasting accuracy, the efficiency of its mobile warehousing workflows, and the reliability of its integration with accounting systems. We simulated common warehouse scenarios to validate its effectiveness for both planners and operators.
Our 10-point framework includes:
- Core Functionality & Feature Set: We assess what the tool claims to do and how effectively it delivers.
- Ease of Use & User Interface (UI/UX): We evaluate how intuitive the interface is and the learning curve for users.
- Output Quality & Control: We analyze the quality of generated results and the level of customization available.
- Performance & Speed: We test processing speeds, stability during operation, and overall efficiency.
- Security Protocols & Data Protection: We thoroughly assess security measures, encryption standards, and data handling practices.
- Compliance & Regulatory Adherence: We verify compliance claims against documented evidence and relevant industry standards.
- Input Flexibility & Integration Options: We check how well it integrates with other platforms or workflows.
- Pricing Structure & Value for Money: We examine costs and subscription models to determine true value.
- Developer Support & Documentation: We investigate the quality of customer support and community resources.
- Risk Assessment & Mitigation: We identify potential risks and evaluate built-in safeguards.
Part 1: Foundational Concepts – Understanding the Fishbowl Ecosystem
This section introduces the core principles of Fishbowl. It contrasts its data-driven approach with traditional methods. It establishes the “why” before the “how” and provides the strategic context for decision-makers.
The Forecasting Advantage: From Reactive to Proactive Inventory Management
Traditional inventory management often relies on spreadsheets and guesswork. This reactive approach is like trying to drive while only looking in the rearview mirror. You only know you have a problem after you have already run out of stock or have too much.
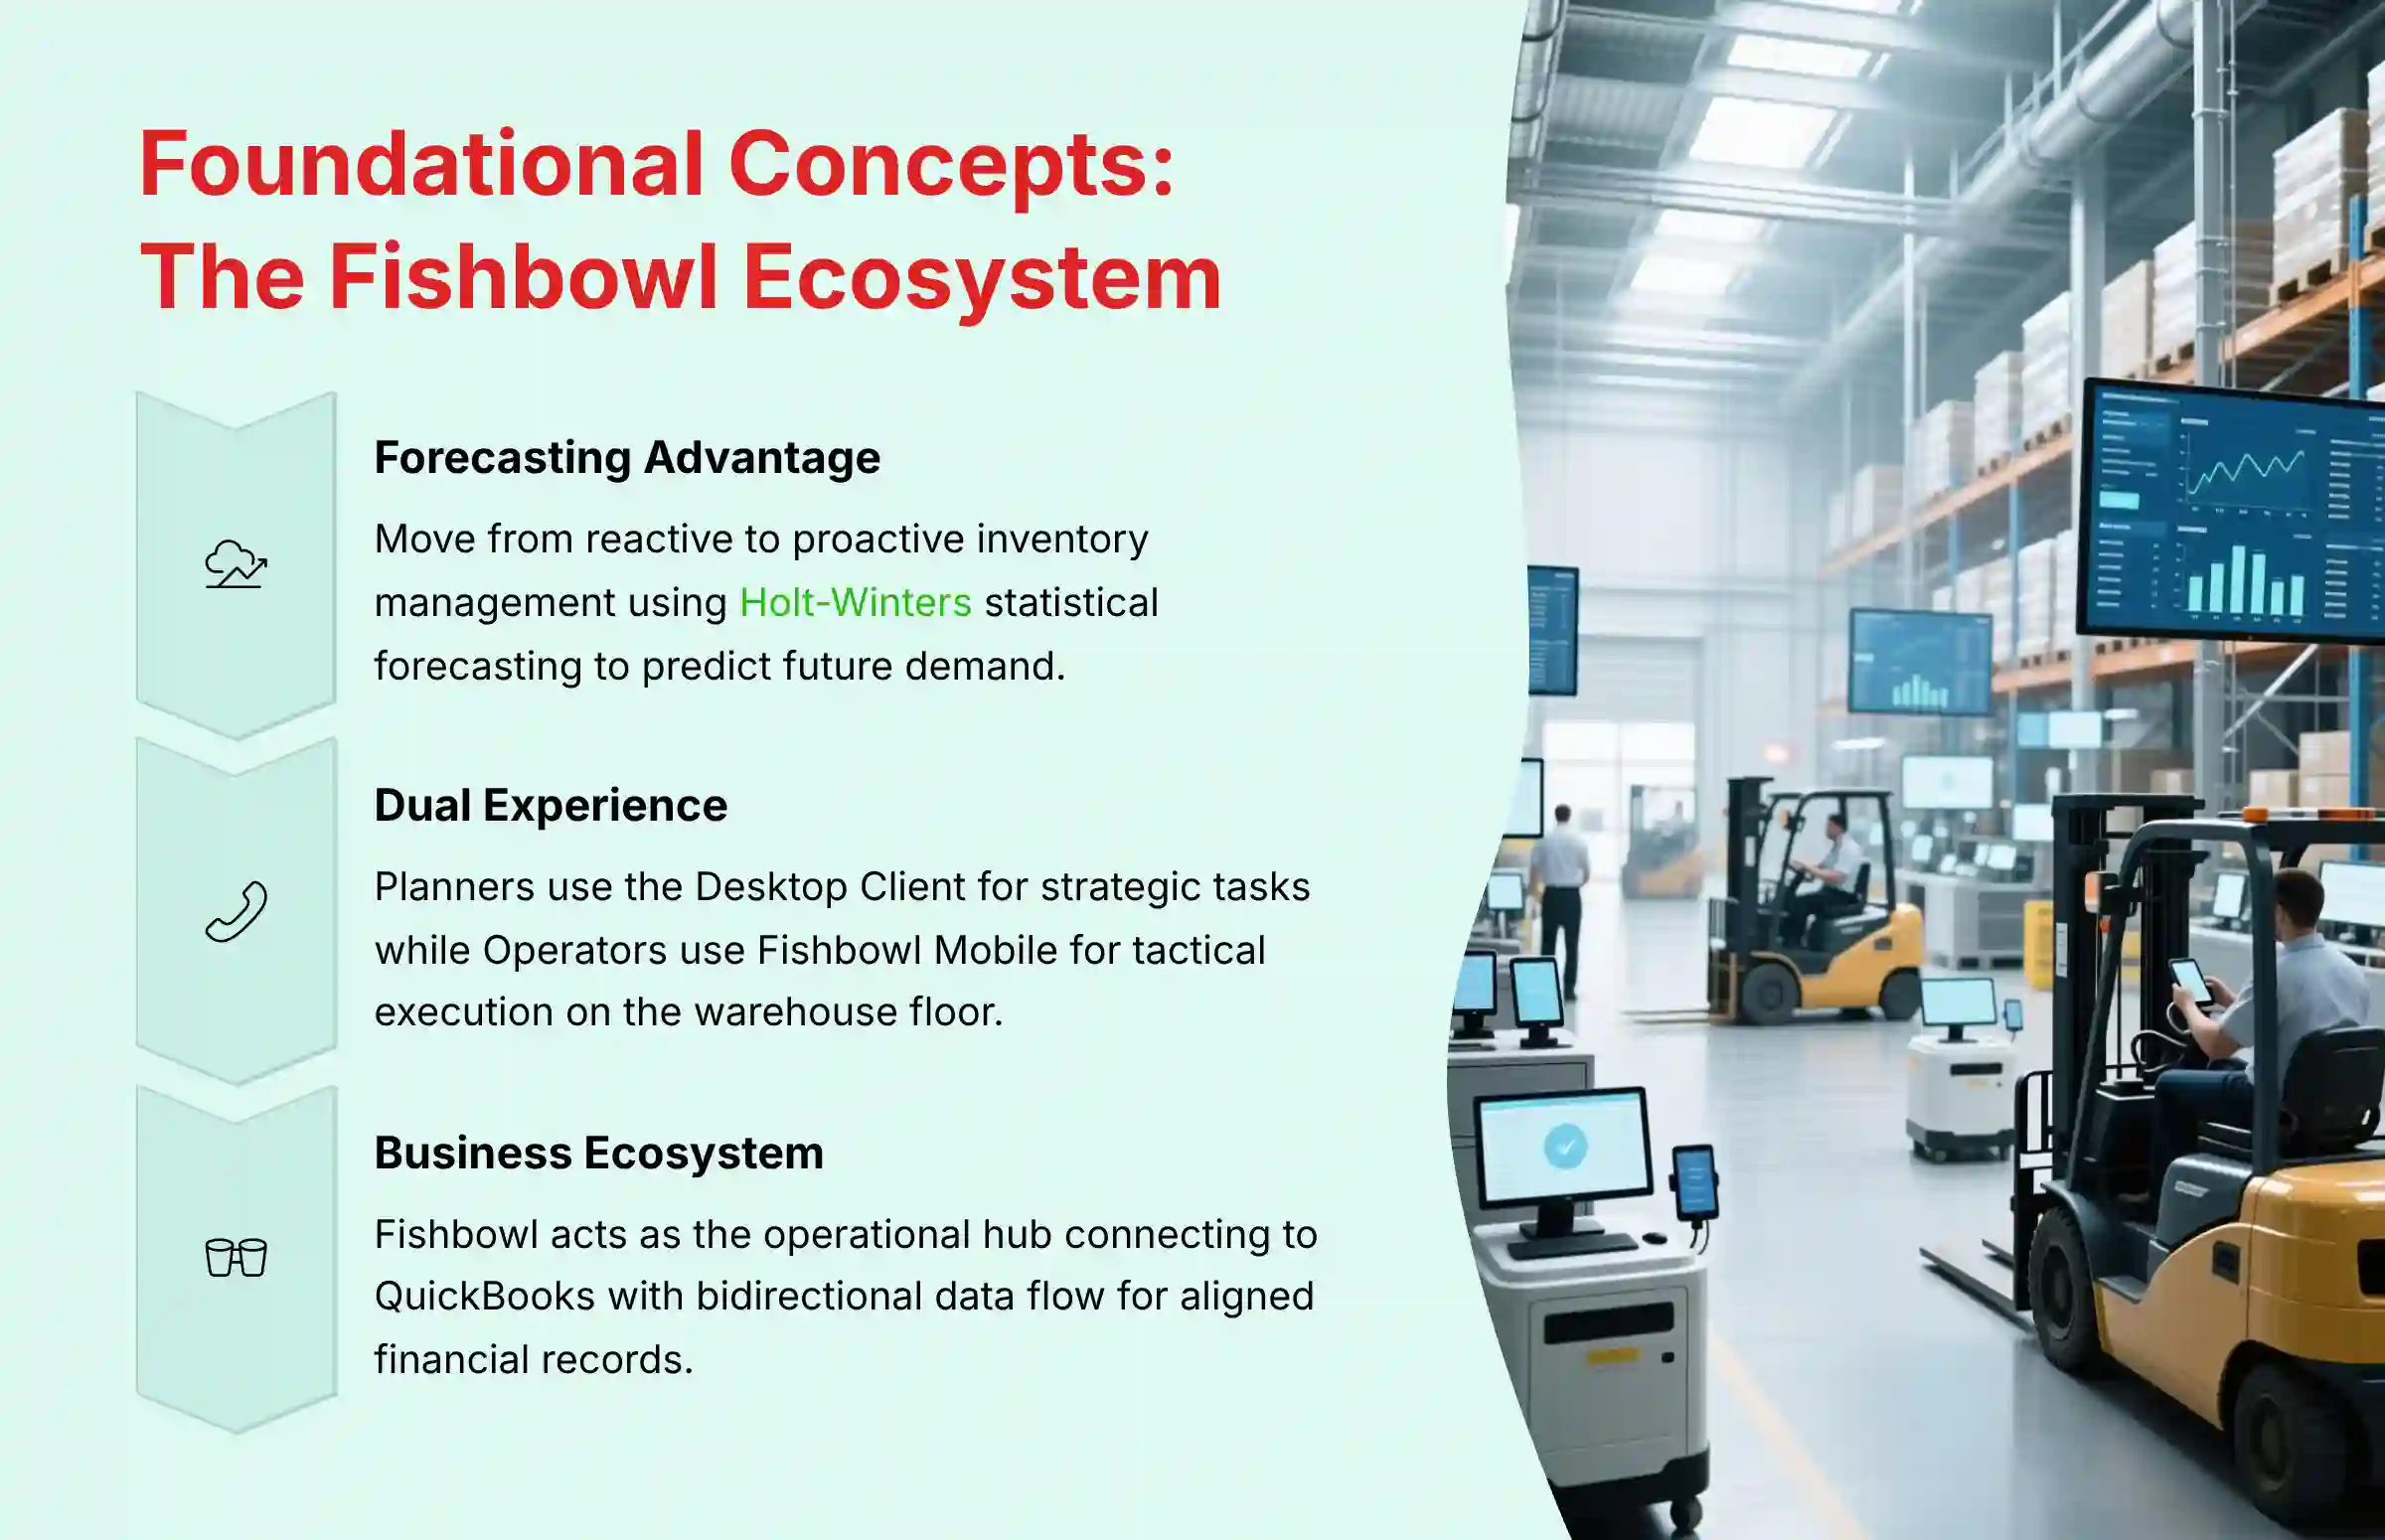
Fishbowl changes this by providing a forward-looking view. It uses historical sales data and forecasting algorithms like Holt-Winters to predict future demand. It's important to note that while marketed as “AI,” Fishbowl's forecasting is primarily based on established statistical time-series models rather than true machine learning.
However, these statistical methods are still powerful and can significantly improve inventory planning. This systematic approach helps mitigate the “bullwhip effect,” where small changes in customer demand create huge swings in inventory up the supply chain. The business impact is direct: reduced carrying costs, fewer stockouts, and a better cash conversion cycle.
The Dual Experience: Architecting for Planners and Operators
A successful warehouse operation requires two distinct but connected roles working in harmony. Think of it as a brain making decisions and hands carrying them out. Fishbowl is built to serve both roles effectively.
The Planner or Manager uses the Fishbowl Desktop Client. This is the command center for strategic tasks like forecasting, reporting, and system configuration. The Operator or Worker uses Fishbowl Mobile on a scanner. This is the tool for tactical execution on the warehouse floor, including picking, receiving, and cycle counts.
The constant data flow between these two experiences increases decision speed and operational accuracy. For detailed comparisons with other solutions, consider reviewing our comprehensive Fishbowl Top Alternatives and Competitors analysis.
The Core Business Ecosystem: Fishbowl's Role as the Operational Hub
Fishbowl is not a standalone island. Its greatest strength is acting as the operational hub that connects to your financial system of record, or ERP. An ERP like QuickBooks is the financial “source of truth.”
The data flow is bidirectional and automatic. When you receive goods in Fishbowl, it creates a bill in QuickBooks. When you ship an order, it generates an invoice. This sync keeps financial records aligned with physical inventory movements.
The Fishbowl API and ODBC driver also allow you to extend this ecosystem to business intelligence platforms for deeper analysis.
Important Update: While Fishbowl previously offered direct integration with Xero, this native integration has been discontinued as of early 2024. Businesses using Xero must now utilize third-party connectors or custom API solutions to link the systems, which may involve additional costs and complexity. Always verify current integration capabilities directly with Fishbowl before making implementation decisions.
Beyond accounting integration, a mature operational ecosystem might connect Fishbowl with a Transportation Management System (TMS) for shipment coordination and potentially a Manufacturing Execution System (MES) for production tracking. This creates a more complete digital supply chain for inventory-centric businesses.
Part 2: Tutorial – Mastering Core Fishbowl Workflows
This section provides step-by-step instructions for the most critical workflows in Fishbowl. Each workflow is framed with a practical business objective. We will focus on data integrity and accuracy as foundational elements.
Workflow 1: Demand Forecasting & Automated Reordering
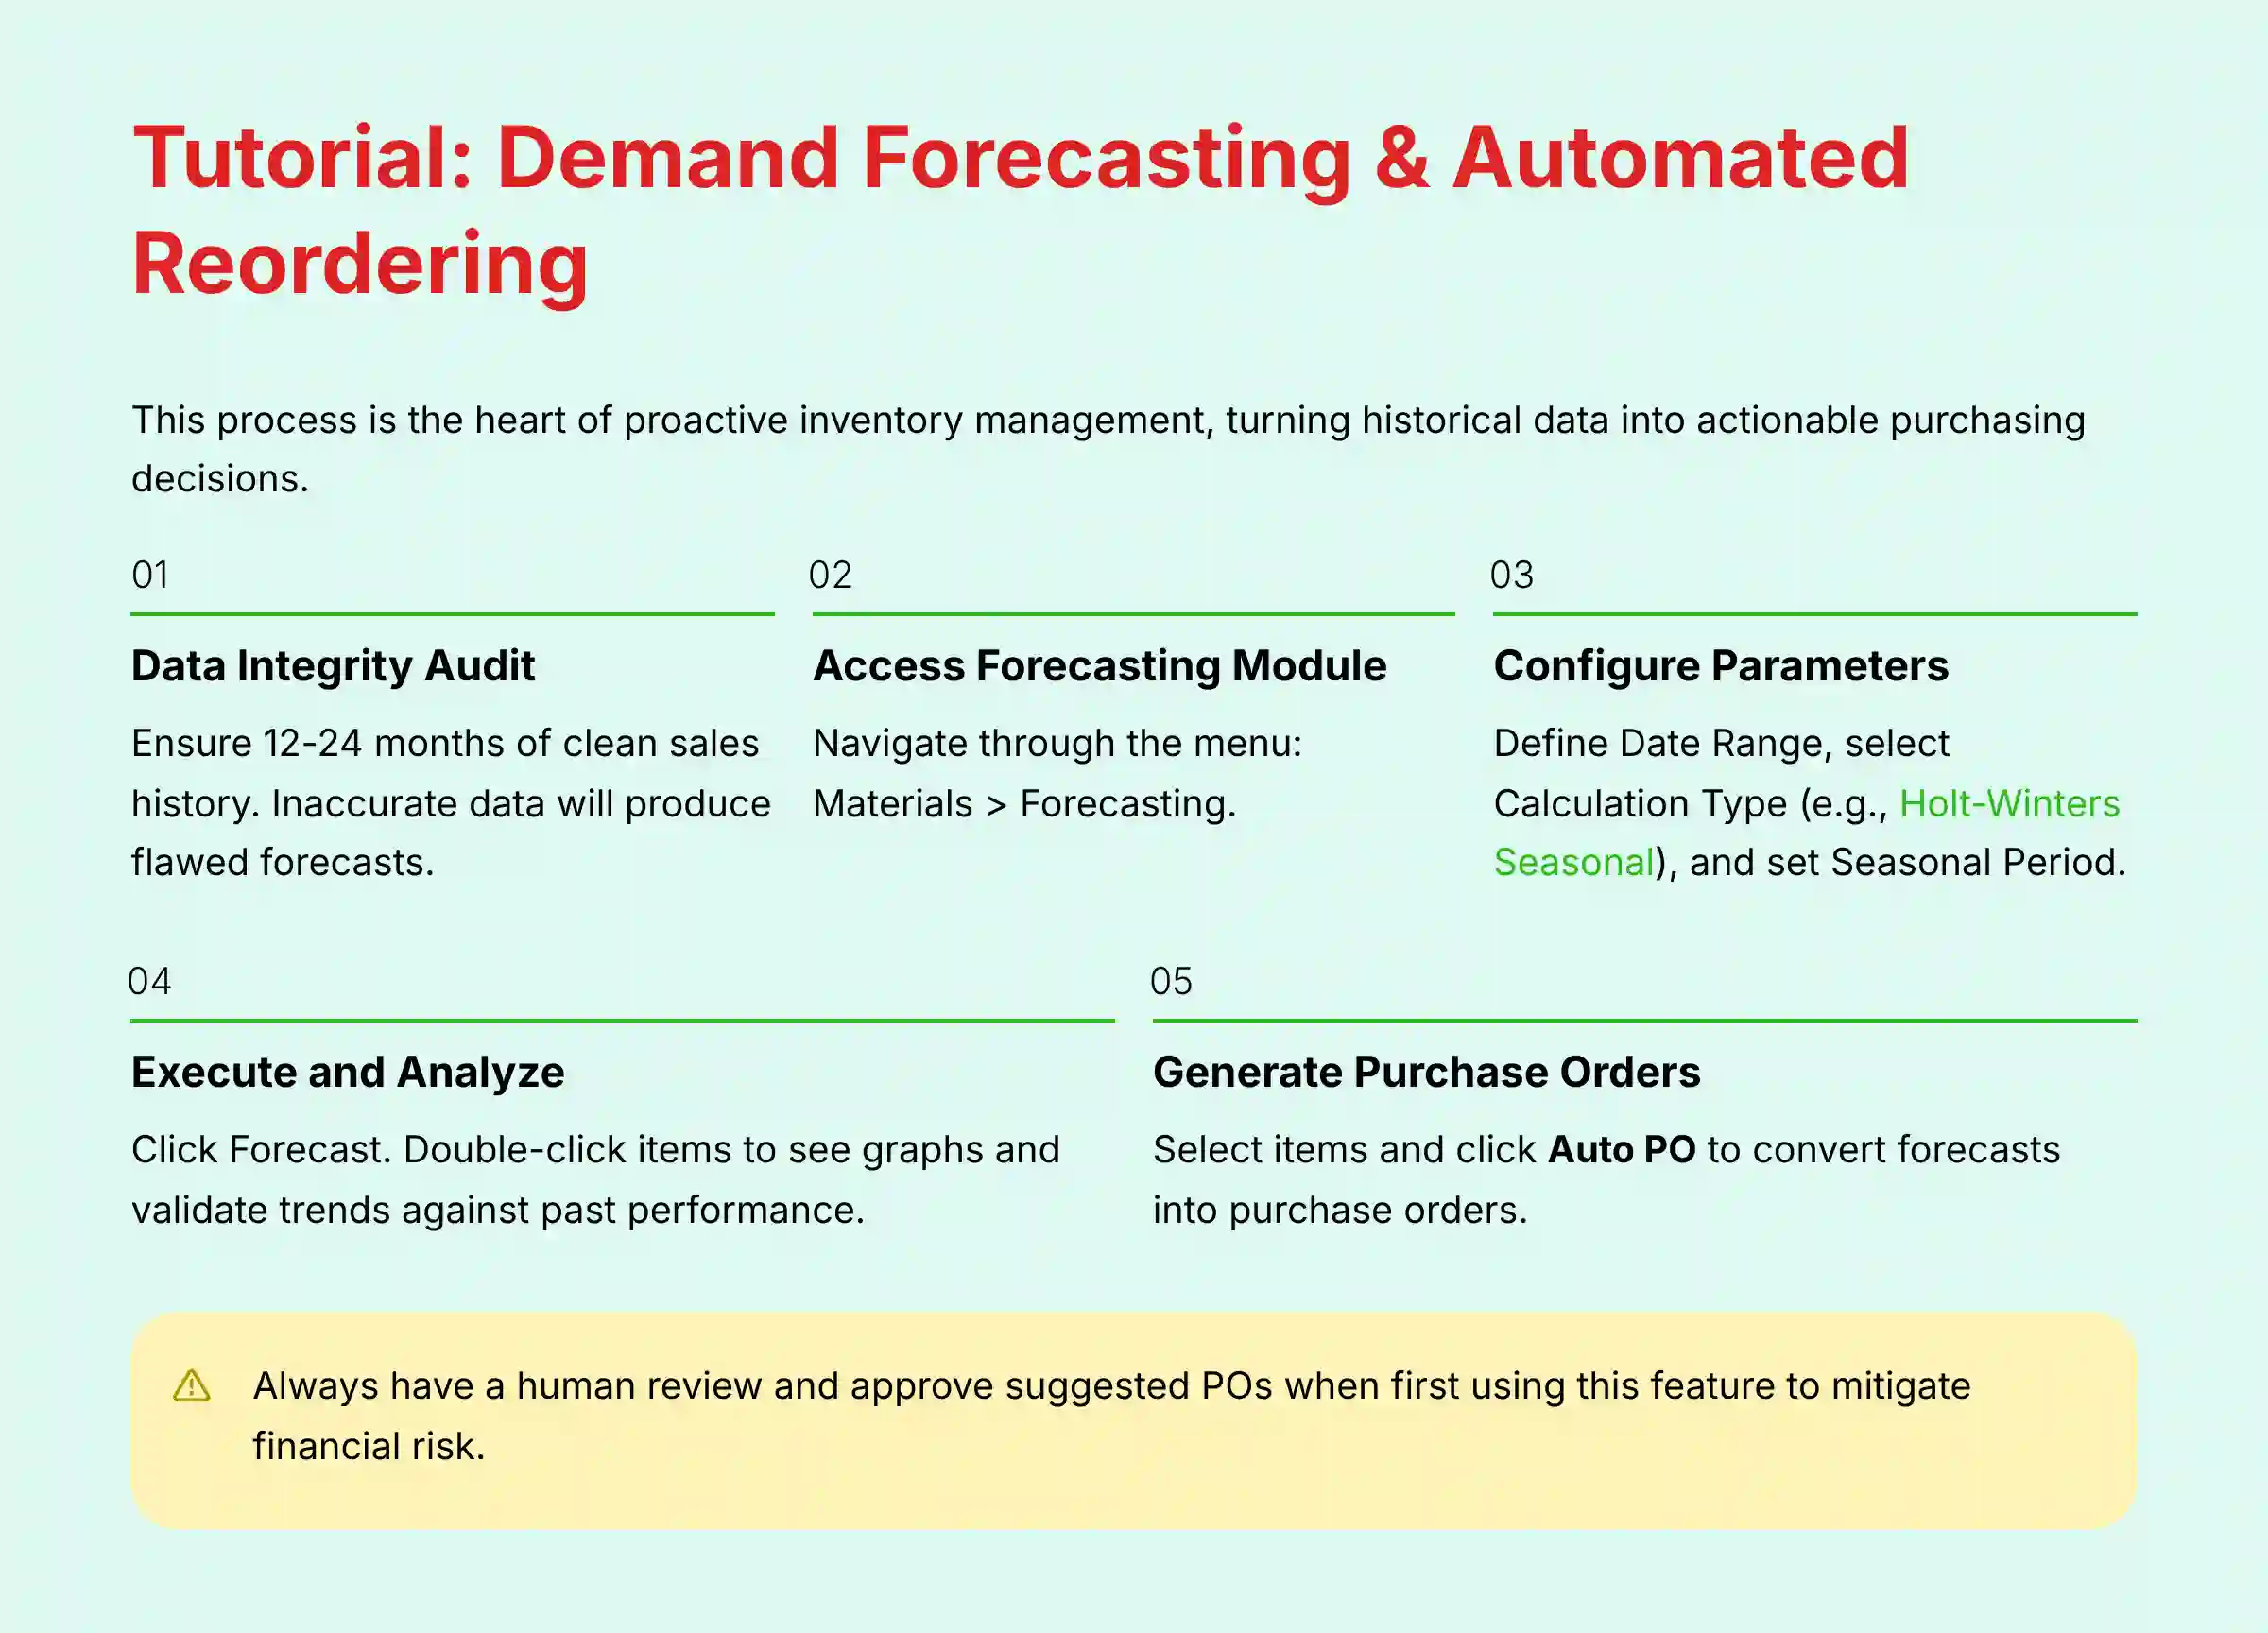
This process is the heart of proactive inventory management. It turns historical data into actionable purchasing decisions. But its effectiveness depends entirely on the quality of your data.
- Step 1: Prerequisite – Data Integrity Audit. You must have 12-24 months of clean sales history. The principle of “Garbage In, Garbage Out” applies here. Inaccurate data will produce flawed forecasts.
- Step 2: Accessing the Forecasting Module. Navigate through the menu:
Materials > Forecasting. - Step 3: Configuring Forecast Parameters. Define the Date Range for your historical data. Select the Calculation Type, such as Holt-Winters Seasonal, and set the Seasonal Period.
- Step 4: Executing and Analyzing the Forecast. Click
Forecast. Double-click an item to see the graph and validate that the forecasted trend makes logical sense compared to past performance. - Step 5: Generating Automated Purchase Orders. Select the items you want to order and click the Auto PO button. This converts the forecast directly into purchase orders.
Important Warning: Incorrectly configured automated reordering can lead to significant financial risk. Always have a human review and approve the suggested POs when you first start using this feature. Remember that Fishbowl's forecasting uses statistical algorithms, not true machine learning, meaning it cannot adapt to external market factors unless you manually adjust the forecasts.
Workflow 2: Real-Time Mobile Warehouse Operations (Picking & Receiving)
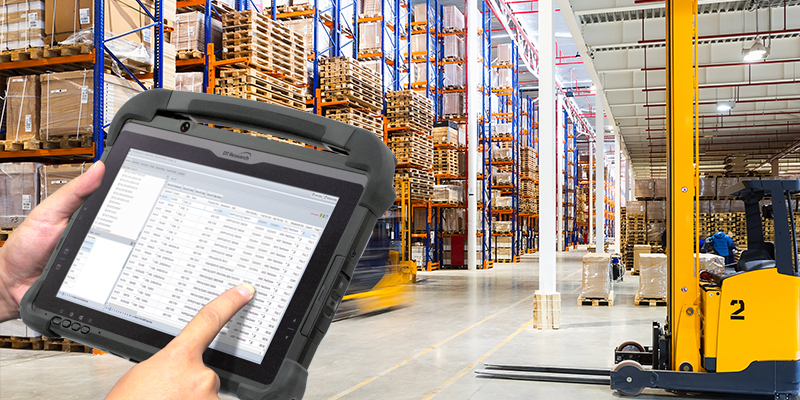
The mobile app is where strategic plans become physical actions. Barcode scanning at every step is the key to achieving near-perfect accuracy on the warehouse floor.
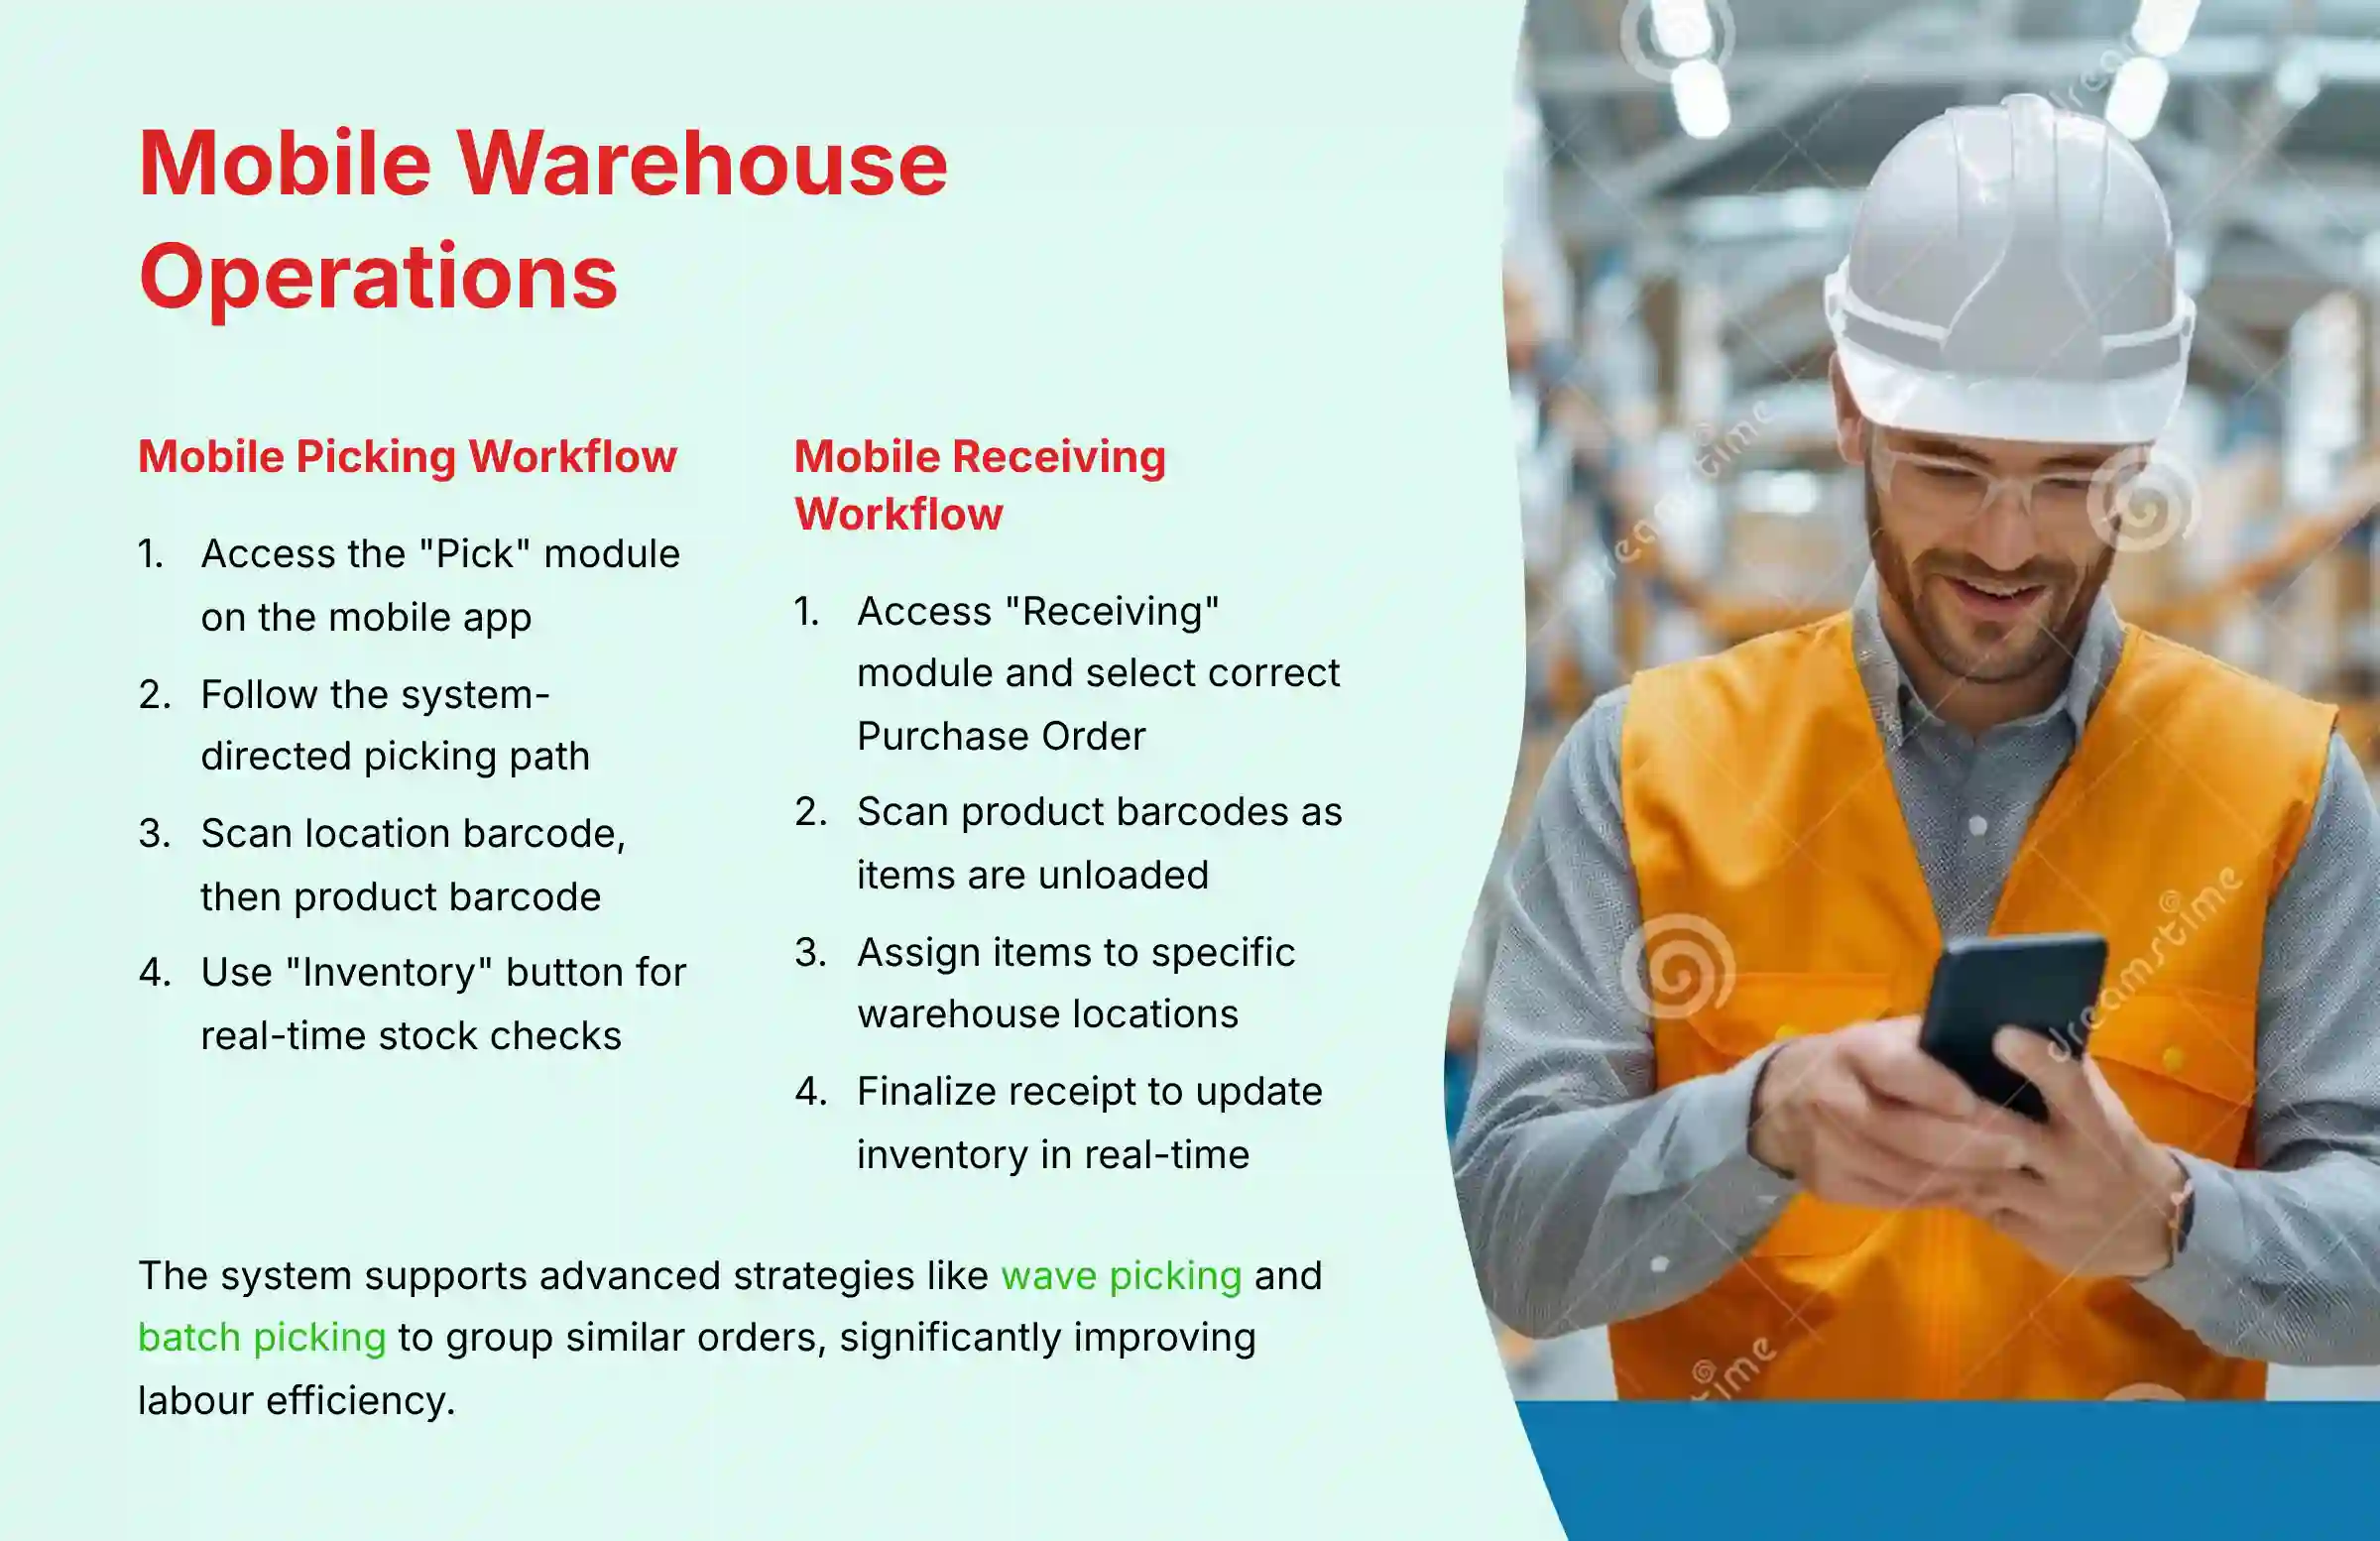
- Mobile Picking Workflow:
- Access the “Pick” module on the mobile app.
- Follow the system-directed picking path for maximum efficiency.
- Scan the location barcode, then the product barcode. This confirms you are in the right place picking the right item.
- Use the “Inventory” button to perform real-time stock checks if you find a discrepancy.
- Mobile Receiving Workflow:
- Access the “Receiving” module and select the correct Purchase Order.
- Scan product barcodes as items are unloaded from the truck.
- Assign items to a specific warehouse location, like Rack A, Shelf 3.
- Finalize the receipt to update system-wide inventory in real-time.
The system also supports more advanced warehouse strategies like wave picking and batch picking to group similar orders, significantly improving labor efficiency. During receiving, it can facilitate a directed put-away process based on pre-configured rules for product velocity (ABC analysis) or characteristics, improving space utilization and future picking speed.
For comprehensive evaluation insights, our in-depth Fishbowl Review provides detailed analysis of performance metrics and user experiences.
Part 3: Use Case Implementation – From Theory to ROI
Here, we deconstruct a real-world business problem. We show how the Fishbowl workflows you just learned were applied to solve it and deliver a measurable return on investment.
Use Case: eCommerce Retailer Improves Inventory Management with Fishbowl + Power BI
This use case shows how connecting Fishbowl to an external BI tool unlocks a higher level of strategic insight. It is like giving your inventory system a powerful new brain for analysis.
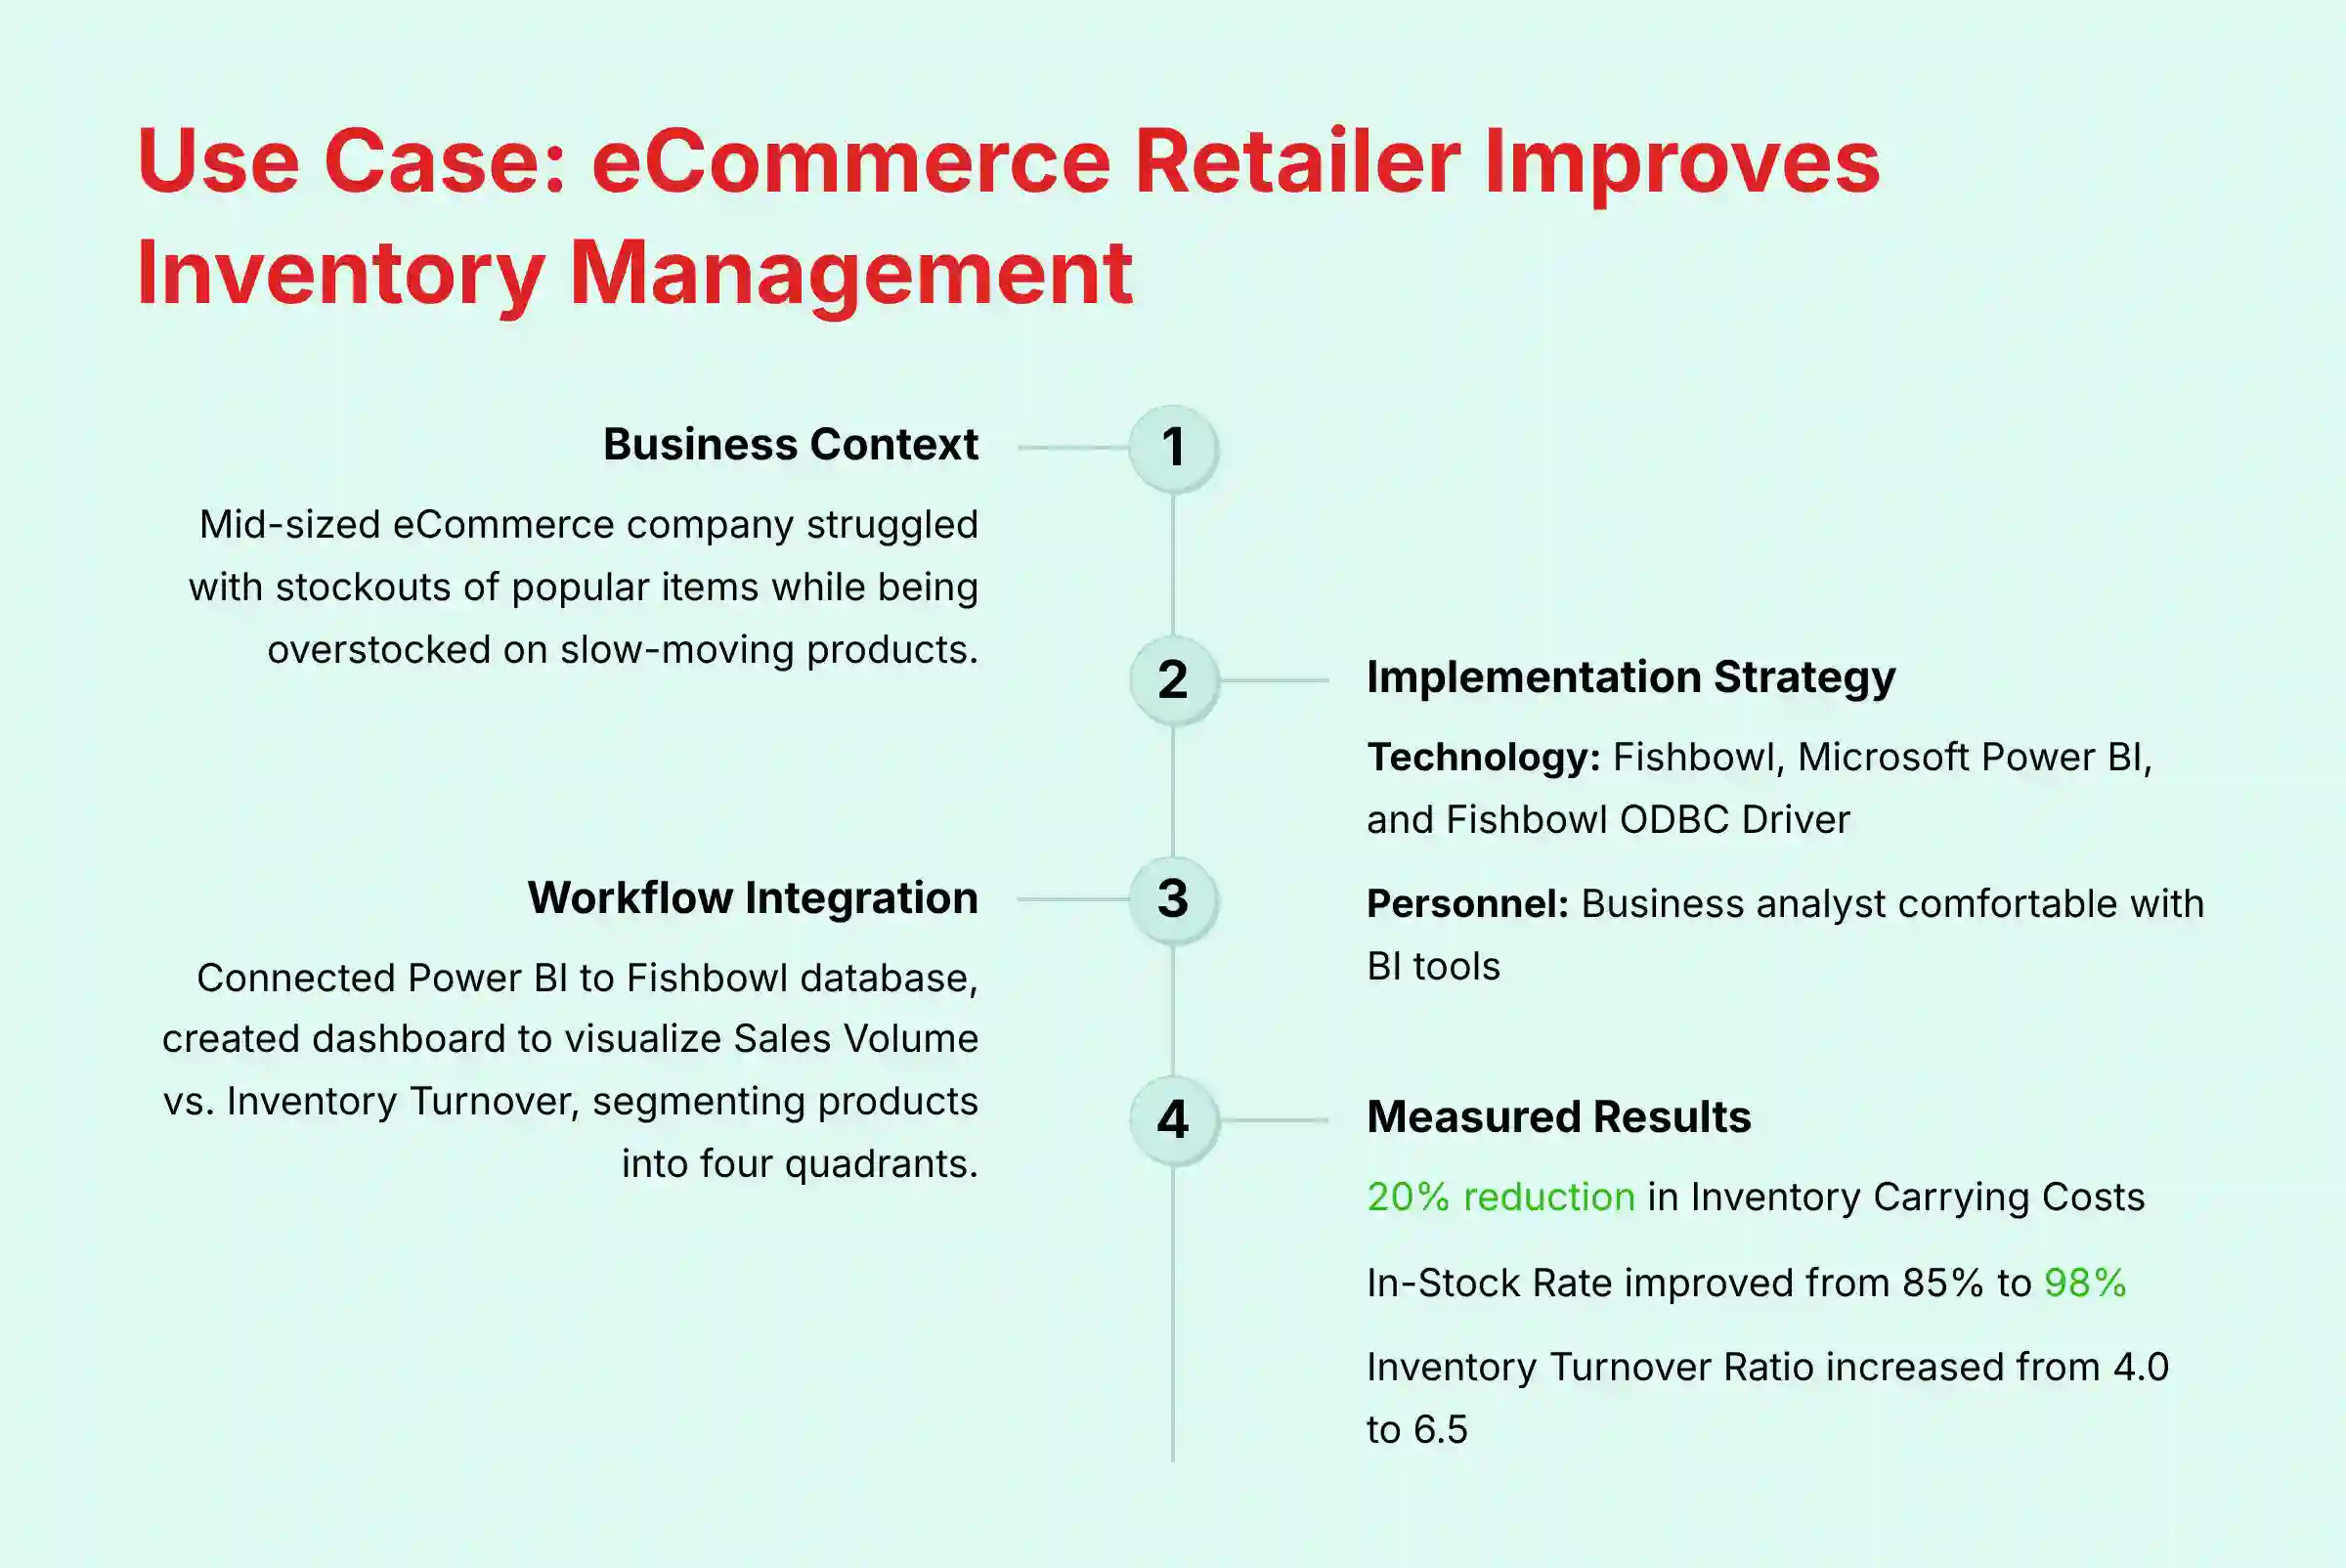
- Business Context: A mid-sized eCommerce company was struggling. They constantly had stockouts of popular items while being overstocked on slow-moving products. This tied up cash and hurt sales.
- Implementation Strategy – Resource & Tech Requirements:
- Technology: Fishbowl, Microsoft Power BI, and the Fishbowl ODBC Driver.
- Personnel: A business analyst or manager comfortable with BI tools.
- Workflow Integration Framework:
- Step 1: Data Integration. They connected Power BI to the Fishbowl database using the ODBC driver.
- Step 2: Analysis-Driven Segmentation. They created a dashboard in Power BI to visualize
Sales Volumevs.Inventory Turnover. This automatically segmented products into four quadrants: “Stars,” “Cash Cows,” “Question Marks,” and “Dogs.” - Step 3: Actionable Workflow in Fishbowl. The purchasing manager applied the Holt-Winters forecast in Fishbowl specifically to the “Stars” to maintain high service levels. They used the “Dogs” quadrant to identify products for liquidation, freeing up capital.
- Outcome Measurement & ROI Calculation:
- Success Metric 1: Reduction in Inventory Carrying Costs. Result: A 20% reduction was achieved in 6 months for this specific business.
- Success Metric 2: In-Stock Rate for “Star” products. Result: The rate improved from 85% to 98%.
- Success Metric 3: Increased Inventory Turnover Ratio. Result: By liquidating “Dog” products and optimizing “Star” inventory, the company increased its turnover ratio from 4.0 to 6.5, indicating much greater capital efficiency.
Important Note: These results represent a specific case study and are not guaranteed outcomes. Your actual results will depend on your starting point, implementation quality, industry dynamics, and specific business challenges. We recommend working with an experienced implementation partner to set realistic expectations and KPIs for your specific environment.
Part 4: Advanced Techniques & System Maintenance
This section provides expert-level guidance for extending Fishbowl‘s capabilities and keeping the system healthy for the long term. Proper maintenance is not optional; it is a necessity for performance.
Troubleshooting: Resolving System Performance Degradation
Over time, you may notice Fishbowl becoming slow, especially when running reports. This is a common issue caused by a bloated SysLog table and fragmented database indexes. Think of it like a filing cabinet that gets messy over time, making it harder to find what you need.
- Identify the Issue: The system is slow, and reports lag.
- Diagnose the Root Cause: A large
SysLogtable and fragmented database indexes. - Implement the Solution (Requires IT Expertise):
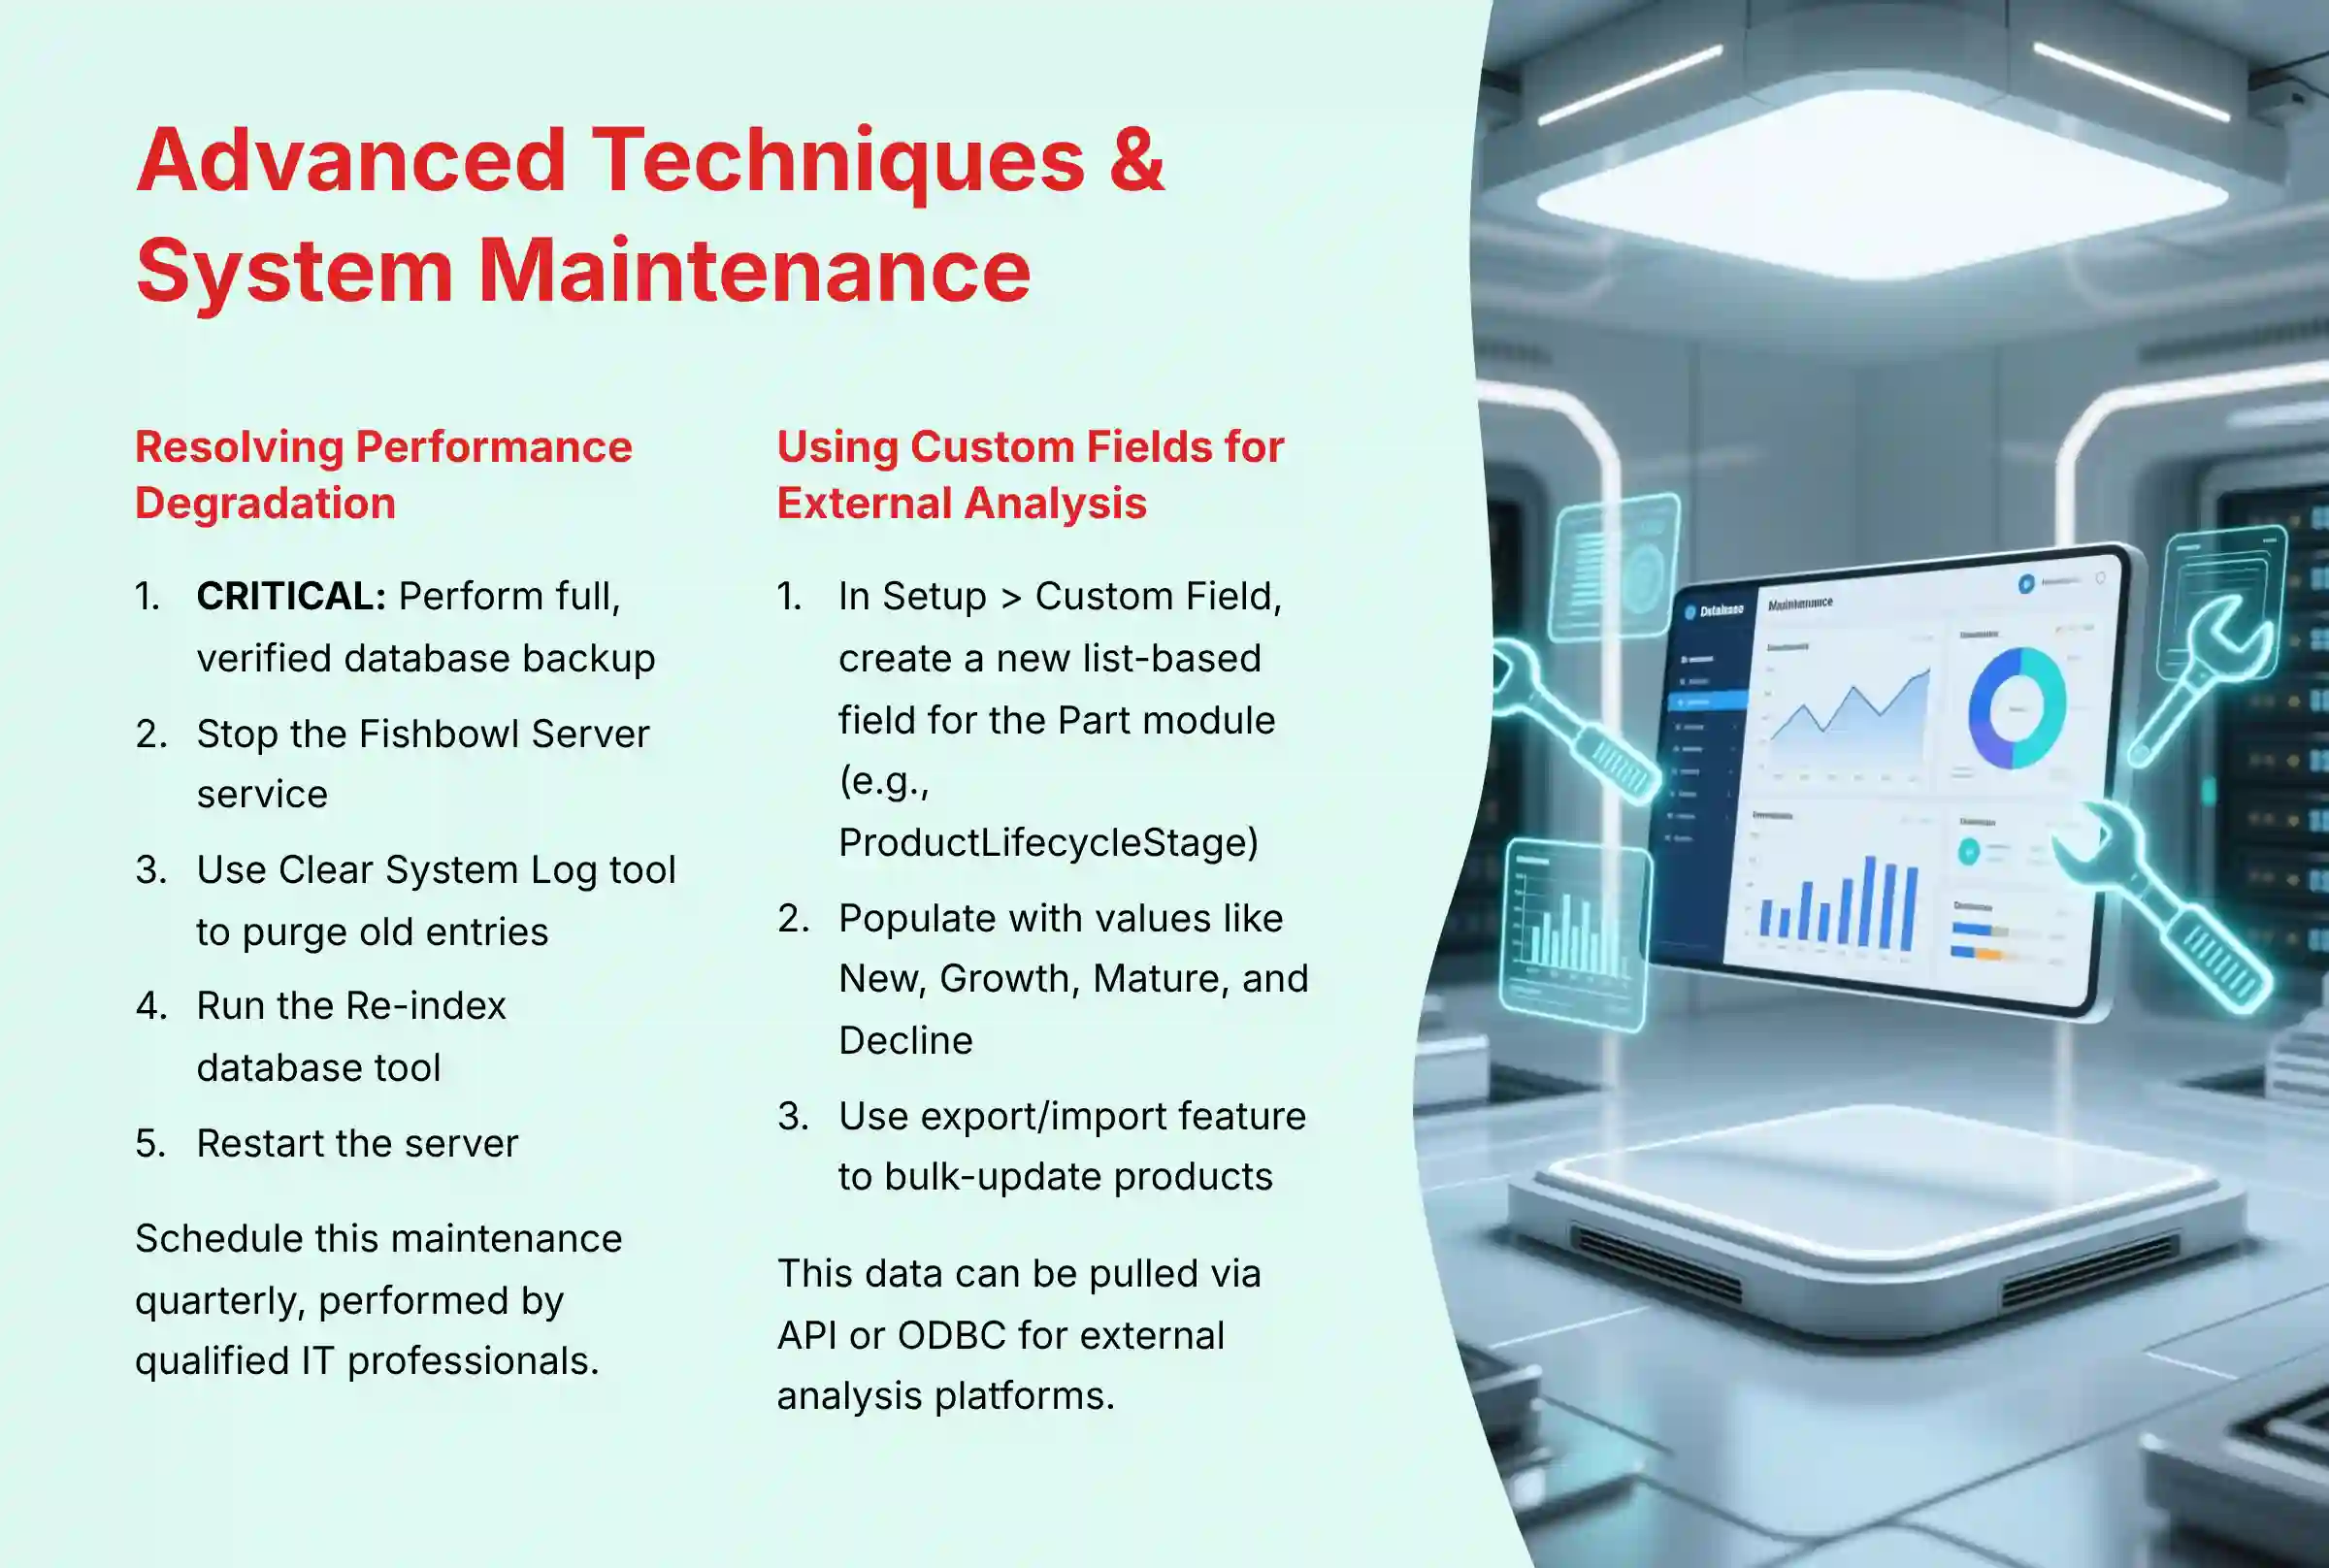
- Step 1: CRITICAL. Perform a full, verified backup of the database before proceeding.
- Step 2: Stop the Fishbowl Server service.
- Step 3: Use the
Clear System Logtool to purge old entries. - Step 4: Run the
Re-index databasetool. - Step 5: Restart the server.
Recommendation: We strongly advise scheduling this maintenance quarterly. It should be performed by a qualified IT professional to avoid data loss.
Advanced Technique: Using Custom Fields for External Data Analysis
This technique allows you to provide richer data to external analysis tools or more advanced forecasting models. It helps you get more accurate and segmented forecasts beyond what is possible with internal tools alone.
- Define the Objective: You want to provide an external system with product lifecycle data to improve forecasting accuracy.
- Execute the Workflow:
- Step 1: In
Setup > Custom Field, create a new list-based field for thePartmodule. Name itProductLifecycleStage. - Step 2: Populate the list with values like
New,Growth,Mature, andDecline. - Step 3: Use the export/import feature to bulk-update products with their correct stage.
- Step 1: In
- Explain the Impact: This new data field can now be pulled via the API or ODBC connection. An external platform can apply different forecasting methods based on a product's lifecycle stage, which can improve accuracy.
For broader context on warehouse management systems, explore our comprehensive guide to the Best 10 AI Warehouse Management Systems (WMS) of 2025: From Chaos to Intelligent Orchestration.
Frequently Asked Questions About Fishbowl Tutorials and Usecase
How Does Fishbowl's Forecasting Actually Work?
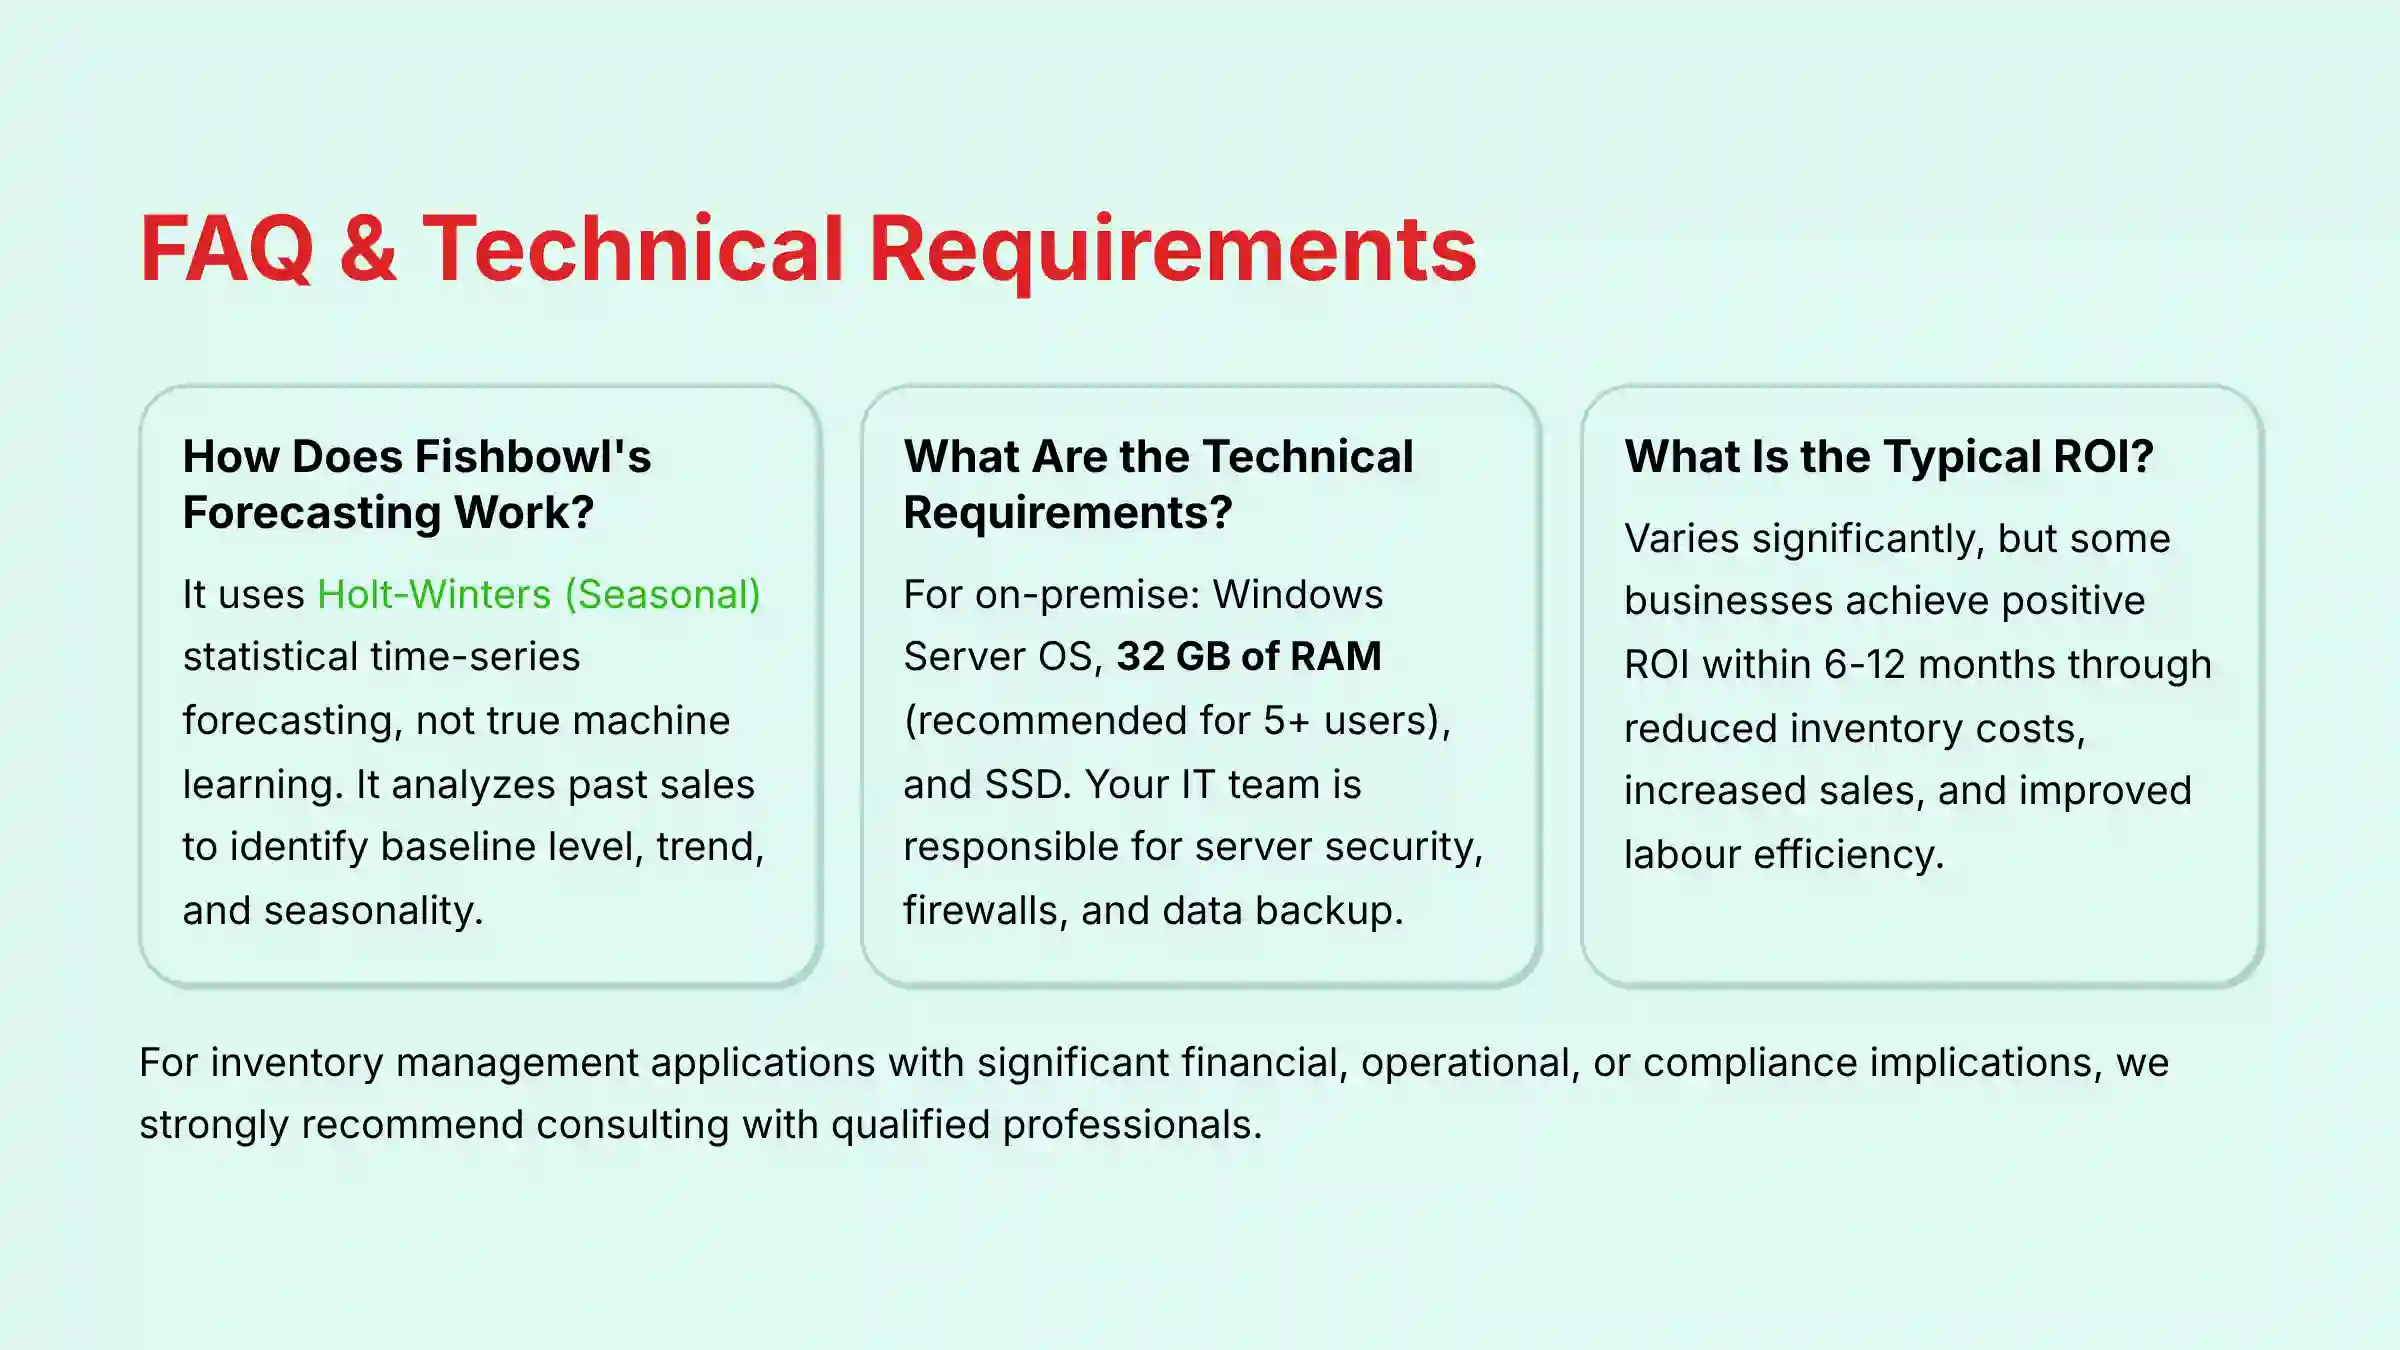
Fishbowl's forecasting capability is rooted in predictive analytics using historical data. Its most advanced algorithm is Holt-Winters (Seasonal), which works well for businesses with cyclical demand. It's important to clarify that while sometimes marketed as “AI,” this is actually a classical statistical time-series forecasting method, not a machine learning system.
The algorithm analyzes past sales to identify the baseline level, the trend, and seasonality. By combining these, it generates a future demand forecast and suggests reorder quantities. While not adaptive machine learning, these statistical models are powerful tools for businesses with consistent demand patterns.
What Are the Biggest Risks When Implementing Fishbowl?
The biggest risk is financial, coming from poor data quality. This is a critical YMYL (Your Money or Your Life) consideration. If you feed the system inaccurate sales history, its forecasting will produce flawed recommendations. This can lead to severe overstocking of the wrong items or critical stockouts of key products. A full physical inventory count is a non-negotiable prerequisite to mitigate this risk.
Additionally, be aware that any automated reordering system introduces financial risk if not properly monitored. When first implementing, have purchasing managers review all system-generated orders until you're confident in the forecasting accuracy for your specific product mix.
How Does Fishbowl Compare to NetSuite for Inventory Management?
Fishbowl and NetSuite serve different markets. Fishbowl is a specialized inventory system designed to integrate with existing accounting software like QuickBooks. It is a strong choice for small to medium-sized businesses needing robust warehouse control.
NetSuite is a complete, all-in-one cloud ERP. It is a better fit for larger organizations looking to replace multiple systems with a single platform.
For businesses already using QuickBooks that need stronger inventory capabilities, Fishbowl can be a cost-effective solution. Companies looking for a complete business management system or requiring advanced multi-entity management should consider NetSuite. The decision should align with your broader IT strategy and growth plans.
What Is the Typical ROI for a Fishbowl Implementation?
The Return on Investment for Fishbowl varies significantly based on your starting point, industry, and implementation quality. Some businesses achieve positive ROI within 6-12 months. As seen in our case study, one business achieved a 20% reduction in inventory carrying costs and improved in-stock rates to 98%. However, these results are not universal or guaranteed.
The ROI typically comes from three areas: reduced inventory holding costs by optimizing stock levels, increased sales by preventing stockouts, and improved labor efficiency in the warehouse through barcode scanning and optimized picking. To set realistic expectations, we recommend consulting with a Fishbowl implementation specialist who can assess your specific situation and develop a customized ROI projection.
Can Fishbowl Handle Multi-Warehouse Operations?
Yes, multi-warehouse management is a core feature. The system lets you create and manage an unlimited number of distinct warehouse locations. You can track inventory levels for each location and generate reordering suggestions on a per-warehouse basis. The mobile app also supports transfers between warehouses with full tracking and traceability.
For businesses with multiple physical locations, this capability provides centralized visibility while maintaining location-specific inventory control. The system can also facilitate inventory transfers between locations, ensuring optimal stock distribution across your network.
What Are the Technical Requirements for an On-Premise Fishbowl Deployment?
For an on-premise installation, you manage the server. Key requirements include a modern Windows Server OS, 32 GB of RAM (recommended for 5+ users), and a Solid State Drive (SSD) for the server. For very small teams (1-4 users), 16 GB of RAM is the minimum requirement, but this is not recommended for normal business operations.
Security Consideration: With an on-premise setup, your IT team is responsible for server security, firewalls, and a robust data backup and disaster recovery plan. This is a responsibility you cannot overlook. Unlike cloud-based systems, Fishbowl's on-premise software does not carry SOC 2 certification, as security and compliance are primarily the responsibility of your organization managing the server.
For businesses requiring certified environments, inquire specifically about the compliance status of Fishbowl's hosting partners if considering their cloud service.
How Do I Fix Common Performance Issues, Like Slow Reports?
System slowness is typically caused by database bloat in the SysLog table. The solution involves routine database maintenance performed by an IT professional. The process includes backing up the database, stopping the server, clearing the system log, re-indexing the database, and restarting the server. This should be done quarterly for best performance.
This maintenance is not optional for long-term system health. If you lack internal IT resources with database expertise, consider contracting with a certified Fishbowl partner for routine maintenance services.
Does Fishbowl Support Barcode Scanning Out of the Box?
Yes, barcode scanning is a fundamental feature, primarily through the Fishbowl Mobile app. The system is designed to be used with standard barcode scanners on the warehouse floor. This function is central to achieving high levels of accuracy and eliminating manual data entry errors.
For optimal performance, we recommend using dedicated barcode scanning hardware rather than consumer mobile devices. Fishbowl works with most Android-based mobile computers and scanners. The investment in proper scanning hardware typically pays for itself quickly through increased accuracy and efficiency.
Is Fishbowl Suitable for Regulated Industries Like Food & Beverage or Pharmaceuticals?
Fishbowl's core feature set provides the foundational data needed for compliance in many regulated industries. Its robust lot number traceability and serial number tracking capabilities are essential for managing product recalls and ensuring accountability from supplier to customer. For businesses in food & beverage, this helps meet food safety requirements.
For medical device or pharmaceutical applications, while Fishbowl can track the necessary data, companies must conduct their own validation to ensure their entire workflow complies with standards like FDA CFR 21 Part 11. We recommend a professional consultation to map your specific compliance needs to the platform's capabilities.
For additional questions and detailed answers, visit our comprehensive Fishbowl FAQs resource.
Important Disclaimers:
Technology Evolution Notice: The information about Fishbowl and AI for Operations & Supply Chain tools presented in this article reflects our thorough analysis as of 2025. Given the rapid pace of technology evolution, features, pricing, security protocols, and compliance requirements may change after publication. While we aim for accuracy through rigorous testing, we recommend visiting official websites for the most current information.
Professional Consultation Recommendation: For inventory management applications with significant financial, operational, or compliance implications, we strongly recommend consulting with qualified professionals who can assess your specific requirements and risk tolerance. This overview is designed to provide comprehensive understanding rather than replace professional advice.
Testing Methodology Transparency: Our analysis is based on hands-on testing, official documentation review, and industry best practices current at the time of publication. Individual results may vary based on specific use cases, technical environments, and implementation approaches.
This guide provides a detailed look at Fishbowl Tutorials and Usecase. By applying these concepts, you can turn your warehouse into a more efficient, accurate, and strategic part of your business.

Leave a Reply